| Corcoran Technical Trading Patterns For June 2 |
| By Clive Corcoran |
Published
06/2/2010
|
Stocks
|
Unrated
|
|
|
|
Corcoran Technical Trading Patterns For June 2
The abrupt reversal in equities during early trading yesterday in the US ran into strong headwinds on the S&P 500 as it entered the price congestion zone around 1190/5 and the path of least resistance in the latter part of the session was decisively downwards. The S&P 500 futures closed the session with a 1.7% loss at 1169 which may have seemed like a rather extreme move but which, on the daily chart, registered an RSI reading of 40 which suggests to me that more probing to the downside - not necessarily in today’s session - still lies ahead.
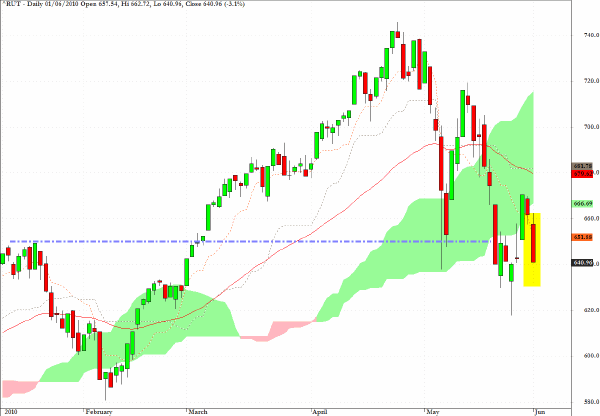
The Russell 2000 was the standout under-performer yesterday with a 3.1% retreat illustrating that high beta is not the place to be (unless you are short) when equities are headed south. Technically the break below the dotted trend line highlights the vulnerability of this index and reinforces my view, expressed here yesterday that the May 25 intraday lows seem like they will need to be tested in coming sessions.
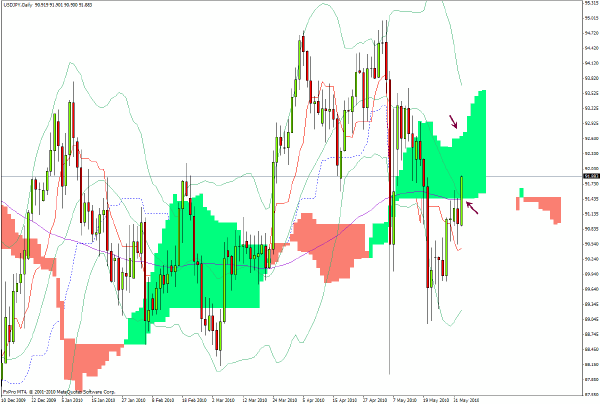
One reason why I would not be surprised to see a relief rally when US equities open for trading today is the chart below showing weakness in the Japanese yen. The break into the cloud and through the 100-period SMA suggests that the flight to safety appetite for the Japanese currency is not in evidence this morning, despite the ongoing woes in European credit markets.
The top of the cloud would be a near-term target.
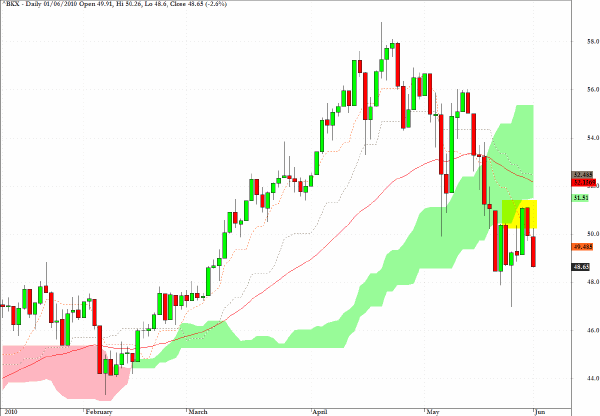
The Banking Index (^BKX) is still struggling and unless it can penetrate the bottom of the cloud formation, which it has failed to do in recent sessions, there should be a tendency for rallies in the banking sector to be seen as opportunity to either initiate or add to short positions.
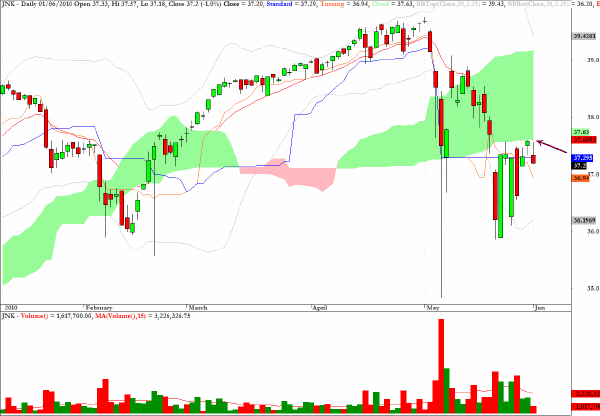
Very similar remarks to those made above for BKX also apply to JNK, one of the exchange traded funds for the high-yielding corporate bond market.
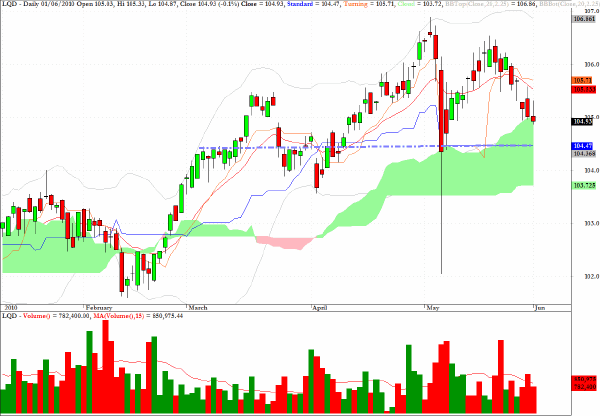
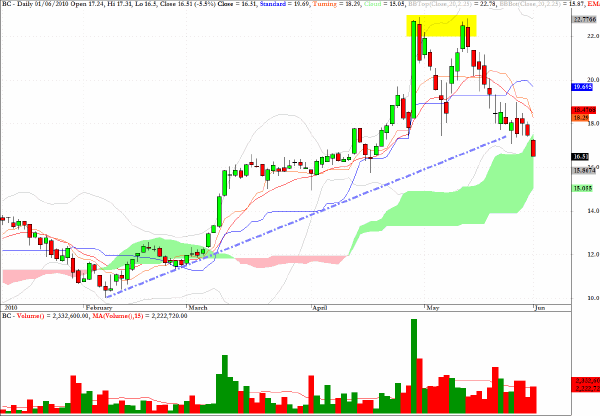
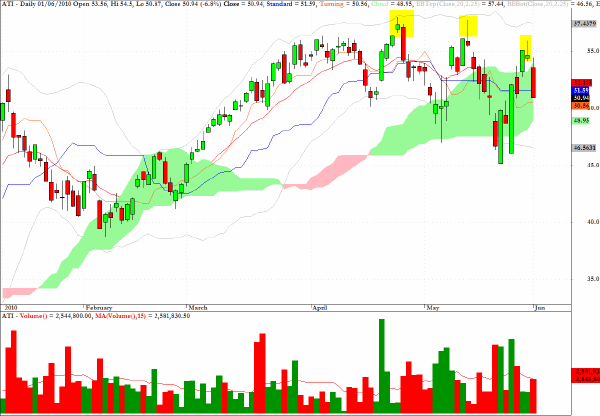
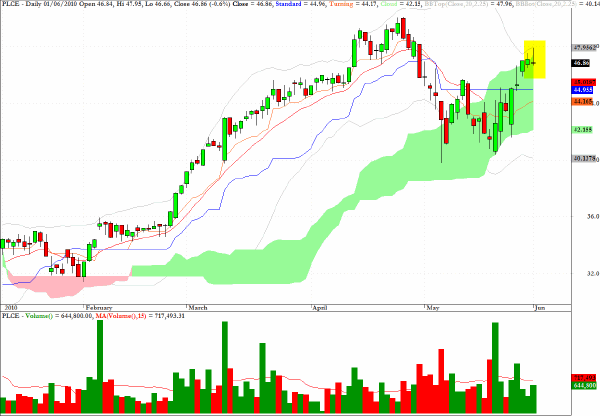
The theme for the remaining charts is taken from the Ichimoku pattern menus available to premium subscribers as it covers a sample of the securities that have entered the green cloud from above - which often suggests that a period of correction within the cloud lies ahead.
LQD, a fund for investment grade corporates, appears headed for the level indicated by the dotted line.
The chart for Brunswick (BC) looks vulnerable to an eventual testing of the bottom of the cloud.
Another example of the pattern theme discussed above can be seen for Allegheny Tech (ATI). In particular it is worth noting the succession of lower highs highlighted.
The remaining chart for today shows a re-entry into the cloud after one day above it for The Children’s Place (PLCE). Also notable on the chart is the gravestone doji candlestick which is often a harbinger for weakness although this should be tempered by the fact that the stock did find support at the base of the cloud and managed to work its way to the top.
In such circumstances, I would probably err on the side of standing aside unless there is a significant spike up, and even then if tempted to enter an opportunistic short side trade I would also have a tight stop in place $1 above the execution price.
Clive Corcoran is the publisher of TradeWithForm.com, which provides daily analysis and commentary on the US stock market.
|