| Corcoran Technical Trading Patterns For June 7 |
| By Clive Corcoran |
Published
06/7/2010
|
Stocks
|
Unrated
|
|
|
|
Corcoran Technical Trading Patterns For June 7
Readers may recall that in Friday’s commentary the point was made that any upset of the not too hot/not too cold scenario for the US recovery, in the wake of the NFP report, could lead to either a move up in yields on bonds or raise the specter of a "double dip". The employment data turned out to be way below the consensus estimate and provides plenty of ammunition for those claiming that the recovery, such as it is, will be far from robust.
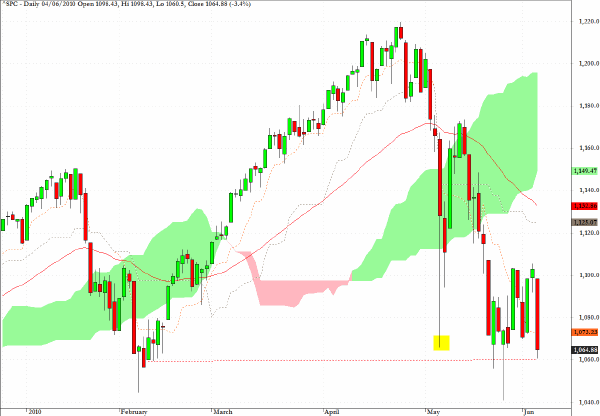
Technically one of the features of Friday’s slump in equities, which was also influenced by ongoing fears about sovereign risk and the plight of the euro, was the fact that the S&P 500 closed below the intraday low from May 6 - the so called flash crash event.
There are now lows in the neighborhood of 1040 from May 25 and earlier on February 5 that would seem to be potential targets in the future. It would not be surprising to see, based on the macro trading background in Europe this morning, some bounce off the open, but it would be surprising to see a sharp V-shaped rally following Friday’s data.
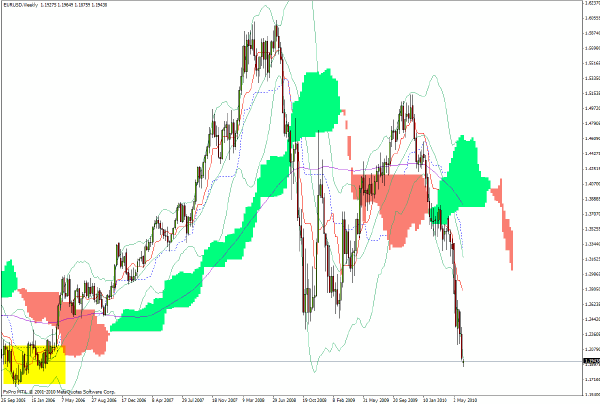
$EURUSD broke down below $1.20 in Friday’s trading and at one point in Asian trading touched $1.1875 which is awfully close to the target level of $1.18 suggested here several weeks ago.
The area highlighted on the weekly chart reaches down to $1.1650 in 2005 and this may well be the next major target but I suspect that traders will want to go back and test both $1.20 and $1.22 again soon. The $1.22 level, which provided support during recent downdrafts, would now become a clear resistance zone, and, if touched, an invitation to aggressively go short the euro again.
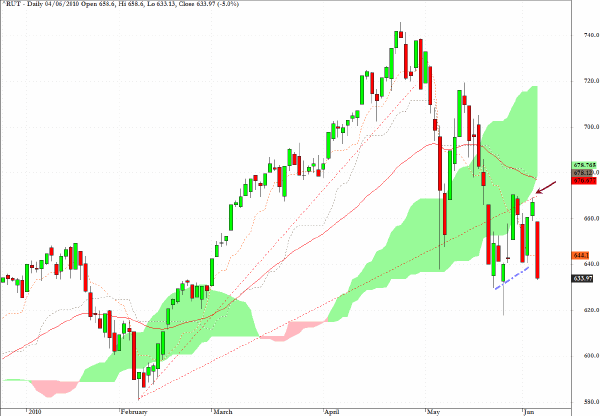
The Russell 2000 once again illustrated that the small cap/high beta stocks are more severely punished when the animal spirits are deflating. The chart looks decidedly bearish in my estimation and an eventual re-visit to the lows from February around 585 seems probable.
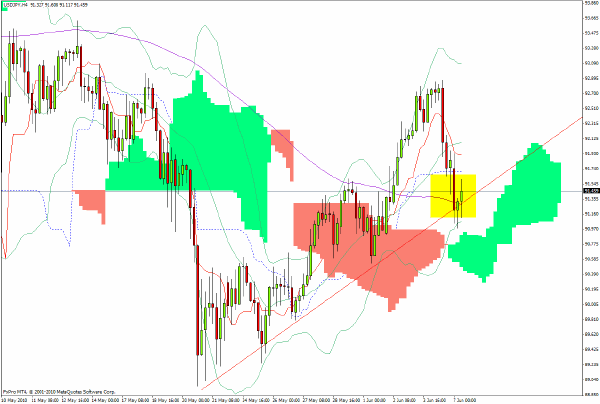
USD/JPY has not broken below a key support line on the 240-minute chart and I take this to suggest that, while traders may not be entirely sanguine about risk assets at present they still have not thrown in the towel. Near-term, that suggests that equities could find a bid, longer-term a capitulation event seems highly likely and would, from a position-trading perspective rather than a scalping viewpoint, keep me away from the long side with equities.
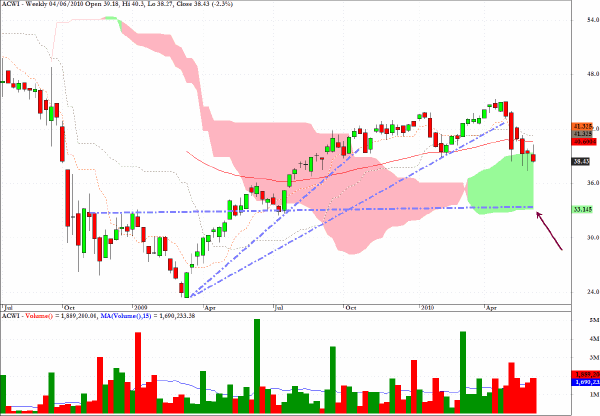
ACWI, is an exchange traded fund which tracks the MSCI All Country World index, and as the chart below indicates there are several technical indicators pointing to an eventual test of the level indicated by the arrow - around $33.
Here are my comments from last Tuesday’s column.
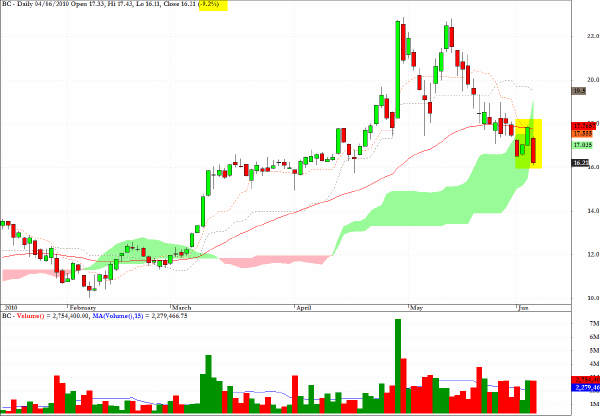
The chart for Brunswick (BC) looks vulnerable to an eventual testing of the bottom of the cloud.
The stock dropped 9.2% in Friday’s session which underlines the significance of the reasoning behind the initial sell signal - the entry of the cloud from above.
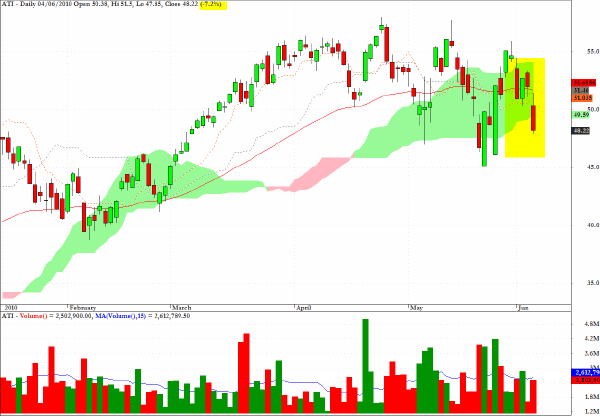
Exactly the same point as above can be made for Allegheny Tech (ATI) which was also alerted here last Tuesday as vulnerable to a fall to the base of the cloud.
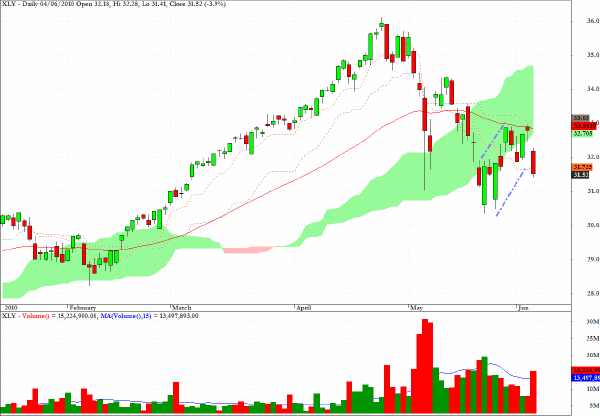
The chart for XLY, the exchange traded fund for the consumer discretionary sector, reveals the "re-thinking" about the vitality of the US consumer sector in the light of Friday’s NFP data.
Illustrated on the chart is a rising pullback channel/bear flag pattern and a clear failure to re-enter the cloud formation. This sector fund looks capable of returning to the $30 level in coming sessions.
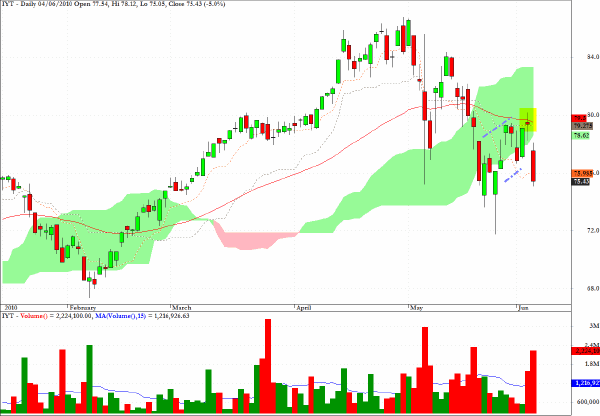
IYT, an exchange traded fund, which tracks the DJ Transportation index, shows another fall from the cloud formation. There is a further example of the bear flag/pullback channel and also notable is the highlighted doji star sitting astride the 50 day EMA from Thursday’s session.
Weakness in the Transports - and the $68 level seems like a feasible intermediate term target - would be in accordance with the view which is now gaining more adherents of a real slowdown in H2, 2010 and a possible "double dip" in 2011.
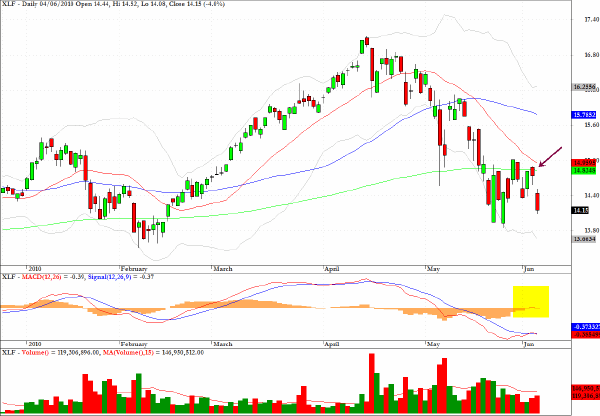
For the chart of XLF, the exchange traded fund for the financial services sector, I have not used the Ichimoku format because I wanted to draw attention to the momentum characteristics as revealed on the MACD segment at the bottom of the chart.
Unlike the very strong positive divergences which revealed themselves in the early part of 2009 with respect to the banks and financials and which proved to be a very profitable buy signal, the MACD chart is not indicating the same kind of constructive divergences and accordingly I would expect continuing weakness from the sector.
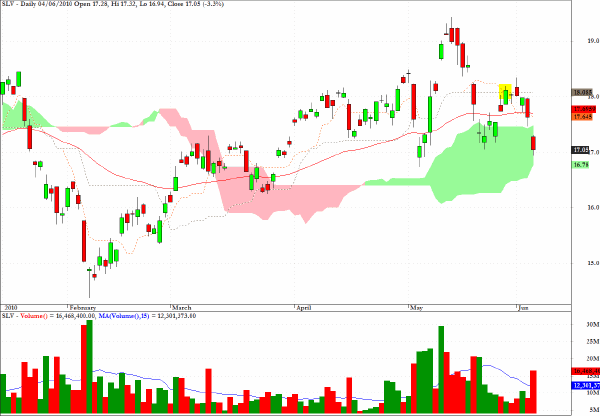
The daily chart for SLV, the exchange traded fund for silver, shows that the junior precious metal could be on the verge of a serious breakdown after Friday’s weak performance which brought the close into the cloud and below the 50-day EMA.
A break below $16.75 on the ETF would put the February low back in play.
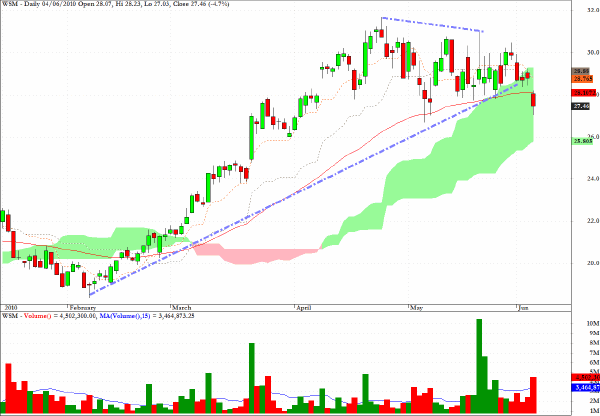
The chart for Williams Sonoma (WSM) shows that one of the stocks which has hitherto shown relative strength, also violated a key upward trend-line in Friday’s trading. It also closed within the cloud and below its 50-day EMA. A good intermediate term target would be $25.
Clive Corcoran is the publisher of TradeWithForm.com, which provides daily analysis and commentary on the US stock market.
|