| Corcoran Technical Trading Patterns For June 10 |
| By Clive Corcoran |
Published
06/10/2010
|
Stocks
|
Unrated
|
|
|
|
Corcoran Technical Trading Patterns For June 10
Despite yesterday’s late sell-off in US equities, the FX market seems not to be rushing to the protection of the US dollar; if anything there has been a slow attrition in the greenback both in Asian trading and also in European trading this morning.
I sense that there are awkward choices to be made among the large-scale macro funds at present with regard to the risk appetite/risk aversion conundrum.
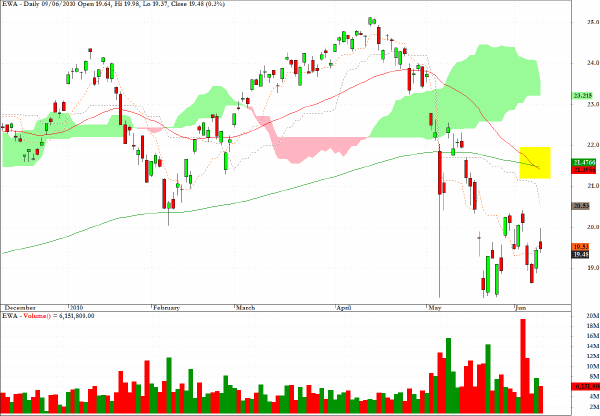
As many of the charts below reveal, there are many sectors where a "Death Cross" (i.e. where the 50-day EMA is dropping below the 200-day EMA) has either just taken place or is about to. Sentiment is fragile and despite an absence of any new shocks from the sovereign debt market in the last few days there are worrying signs that the European inter-bank market is losing confidence in a similar manner to that seen in H2, 2008.
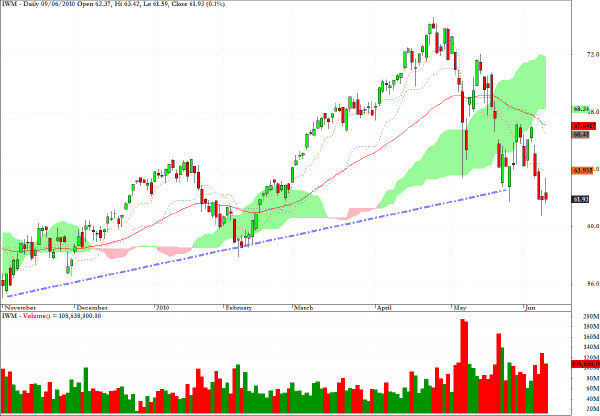
Turning to IWM, the exchange traded fund for the Russell 2000, the chart below reveals that this index has clearly violated a long-standing trend line which dates back to November 2009. Could we see a right shoulder develop? Certainly that is what many technicians are expecting to see - but I am somewhat skeptical.
Having said that, I would not be surprised to see a rally in the cash index back to around the 660 level (equates to roughly 66 on IWM) and then stiff resistance should kick in - which brings me back to a target of 580 on the cash index which seems viable in the next few weeks.
EUR/USD is finding some traction in trading in Europe with a rally back to 1.2085 at the time of writing. As suggested here last week, I would expect this rally to eventually test 1.22 but I would expect substantial renewed selling pressure to emerge at this level
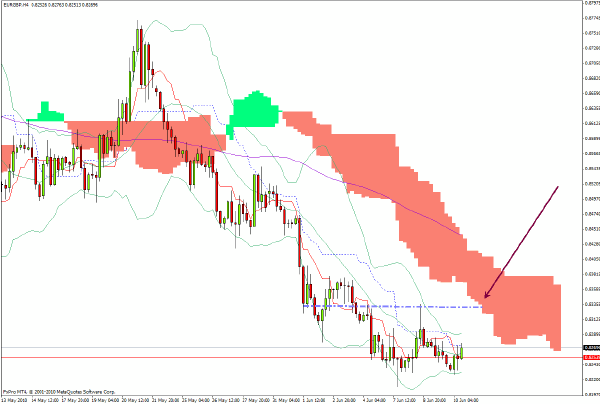
My preferred play at present would be to buy EUR/GBP on weakness and expect a rally towards the level indicated on the chart below. Sterling is now facing more pressure - at least in the near term - until the details of the UK budget are announced and until Fitch, and the other credit rating agencies, have expressed further concerns about the troubled state of the UK public finances.
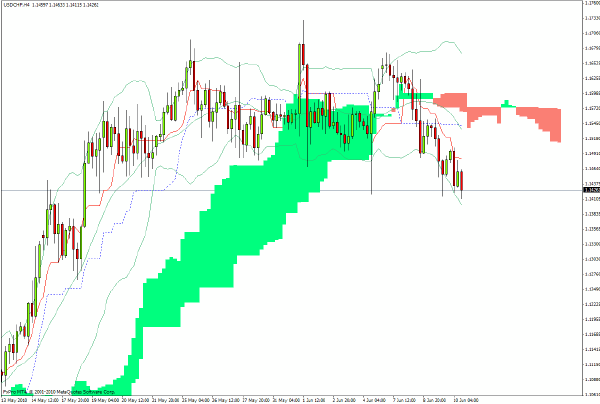
USD/CHF is at a critical level and a decisive drop from current levels would suggest that the safe haven play for the US dollar may be temporarily on hold.
I would not recommend a position on the cross rate but suggest keeping an eye on the pair for clues as to the strength and quality of any rally into risk assets.
The news regarding BP goes from bad to worse and there would seem to be a case for suspending the dividend - not because the company cannot afford it but out of political expediency.
The dreadful ecological devastation resulting from the spill, in my opinion, only serves to highlight the fragility of complex business process and the underestimation of the risks involved. If that sounds familiar, that was how it was intended. While there may be little obvious comparison between deep sea drilling and the inventions of financial technocrats - when things go wrong the consequences are far worse than the worst-case scenarios predicted by the "experts".
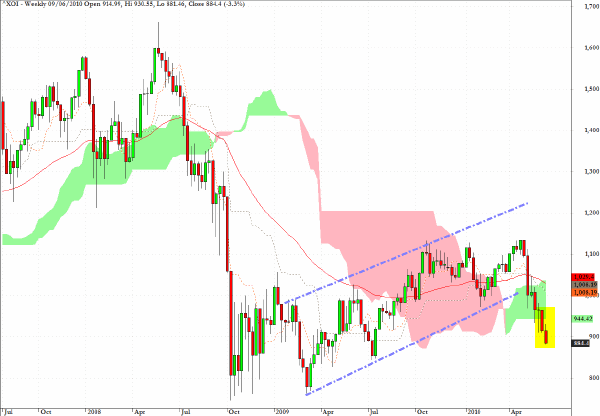
The weekly chart for the Oil Index reflects this new heightened awareness of risk as a clear buy channel which was in effect during 2009 and until recently has been convincingly violated as revealed on the chart below.
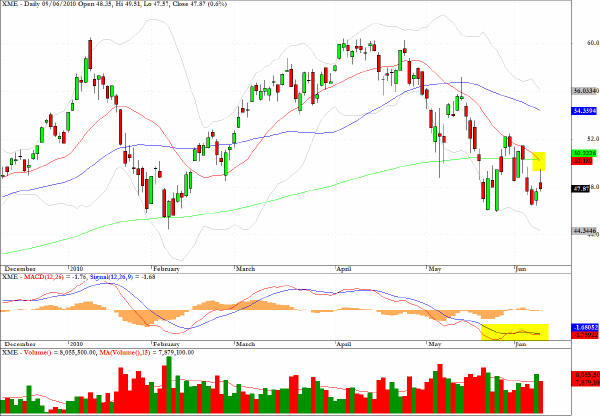
Exemplifying my earlier remarks about the "Death Cross", the chart below reveals that we are on the threshold of this occurring for XME, a sector fund mining and metals.
The MACD segment is somewhat supportive for those looking at the long side for a bounce trade but the trend is clearly down. Any temptation to play the bounce should have a firm exit target at $50.
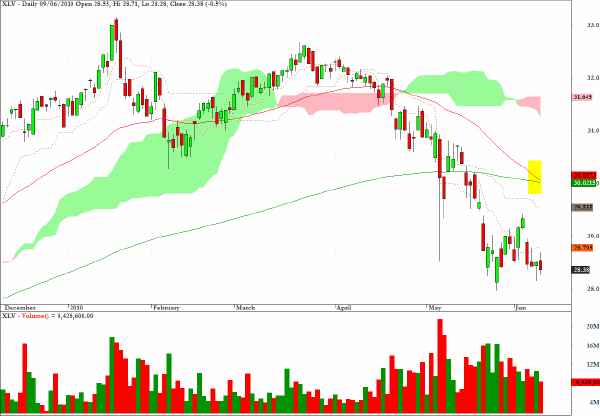
I would make a very similar case for XLV - a sector fund for health care - as was made above for XME as yet again the 50-day EMA is on the verge of dropping below the 200-day EMA. In such a case this represents an obvious area of resistance to any rally effort from here.
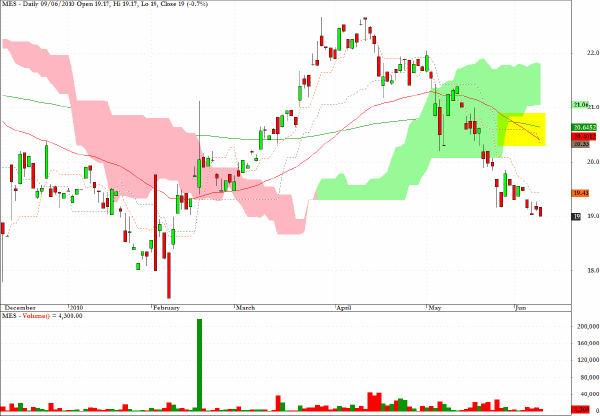
MES, an ETF providing exposure to the Gulf States region, looks vulnerable to further downside towards the February low.
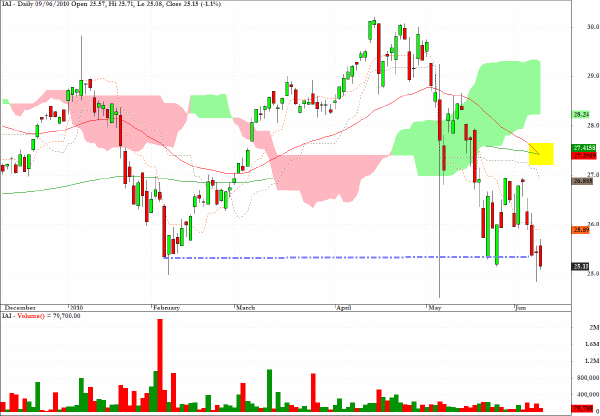
IAI, a fund which tracks the investment banks and brokerage industry, is at a pivotal level and also reveals that the "Death cross" is about to take place. It may be too late in the day to get short but any meaningful rallies would provide good entry points on the short side.
Perhaps the best tactical opportunity for those looking to scalp a bounce on another ETF which has suffered recently and is about to confirm the "death crossover" is EWA - which provides exposure to Australian equities. The renewed enthusiasm regarding China’s growth has a direct impact on Australian equities - and the Aussie dollar - and at present there seems to be a bit of a bandwagon developing for the notion that China will lead the world away from the real risk of a double dip.
This bandwagon may not last long but it could lead to some upward price pressure on a variety of risk assets including XME (as discussed) and could be seen as adding a bit more credibility to the potential emergence of a right shoulder for the S&P 500.
Clive Corcoran is the publisher of TradeWithForm.com, which provides daily analysis and commentary on the US stock market.
|