| Corcoran Technical Trading Patterns For June 11 |
| By Clive Corcoran |
Published
06/11/2010
|
Stocks
|
Unrated
|
|
|
|
Corcoran Technical Trading Patterns For June 11
There has been a notable change across the asset class spectrum in the last 72 hours indicating that risk appetite is increasing.
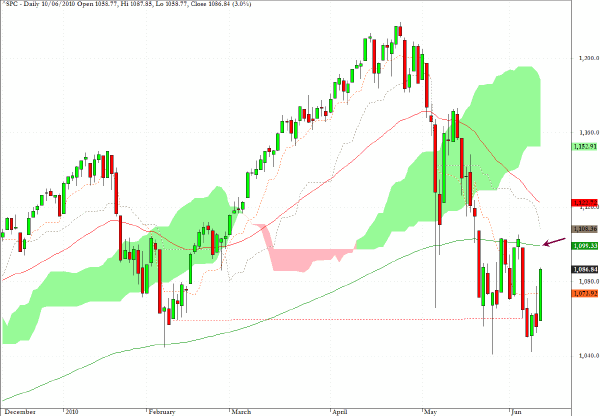
The S&P 500 rallied strongly off the open yesterday as expected, then entered a complex consolidation phase which lasted most of the middle part of the session, and then closed with a late rally.
From my Twitter account yesterday I suggested that there were twin targets which I now believe are in play for today’s session.
1. The S&P 500 cash index will need to break above 1094 - which I suspect it can do - but will then find stiffer resistance at 110, which, as the chart below illustrates, is also the level for the 200-day EMA
2. I believe that the euro will attempt a challenge at the $1.22 level in today’s session.
Since there is some inter-connection between the two events and since I expect that EUR/USD will encounter stiff resistance starting from $1.2185 up to $1.22, it would not be surprising to see both stall at the levels suggested in the near term.
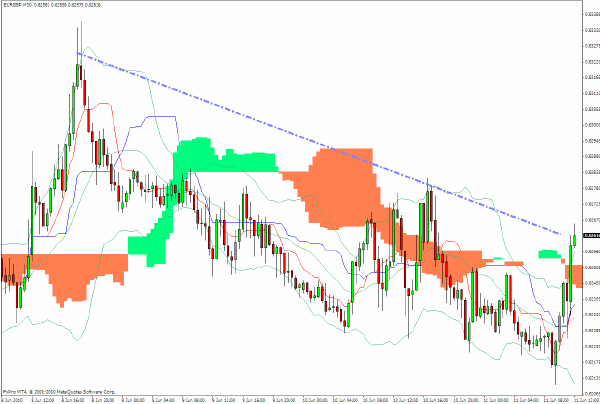
EUR/GBP has been very volatile but is still showing a tendency to want to go higher and if the cross rate can decisively break above .8280 - the level indicated on the 30-minute chart below - then further progress back towards 0.8380 should be expected in the coming sessions.
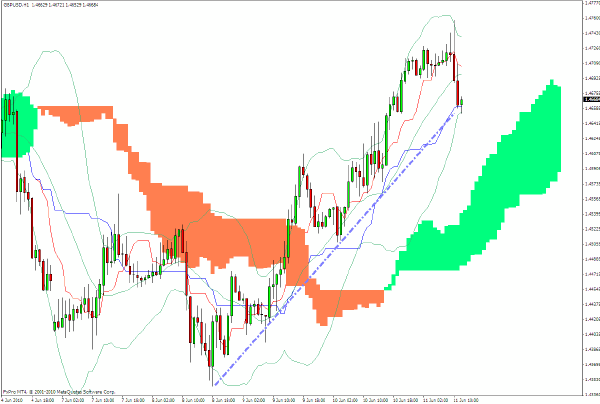
GBP/USD has risen steeply over the last two days and I would suggest that it has now put in an intermediate-term top, which would be confirmed once the dotted trend-line is convincingly broken.
I would suggest that the first area of support will be the top of the cloud formation around 1.4640 and then further support at $1.4580.
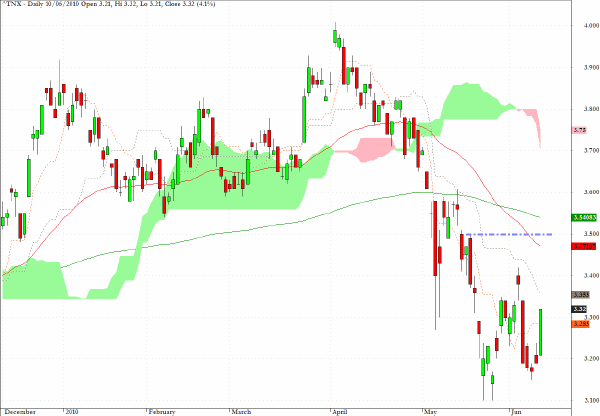
As the appetite for risk assets grows again (for how long is debatable) then the US 10-year note yield should move back towards 3.5%.
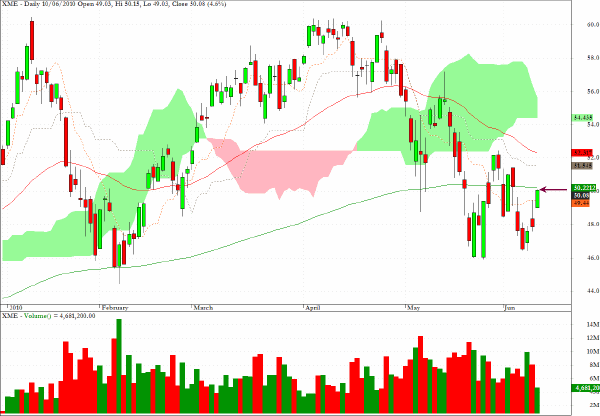
A short-term scalp with XME discussed here yesterday moved up to the $50 level as expected. From here upwards the risk/reward ratio increases but if risk appetites are back in favor we could potentially see a move up to the cloud formation.
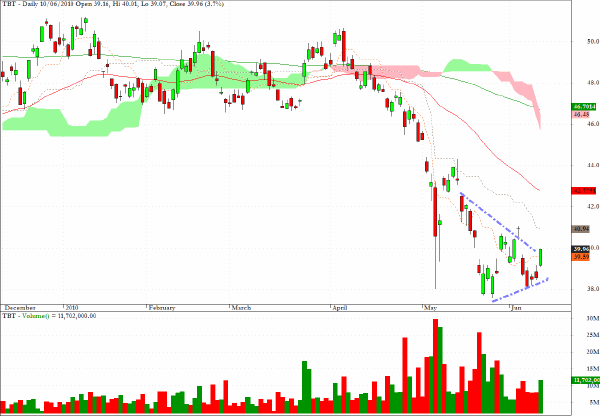
The chart for TBT, which moves in tandem with increased yields on long-term US Treasuries, suggests that a feasible target in coming sessions would be the 50-day EMA (the red line) which is in the vicinity of $42.50.
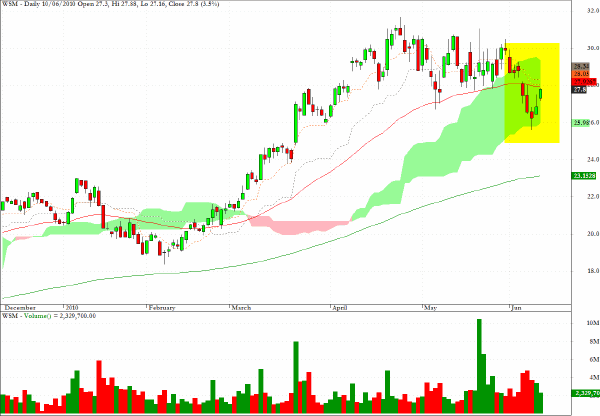
The chart for Williams Sonoma (WSM), which I drew attention to last Friday as a candidate for the short side, proves, yet again, how useful the cloud formations are in setting entry/exit targets.
Notice how Tuesday’s candlestick peeked below the cloud but came to a close just above the cloud.
A profitable trade would have resulted from an entry at last Friday’s open, subsequent to entry within the cloud and with an exit on Tuesday’s close after peeking below the cloud.
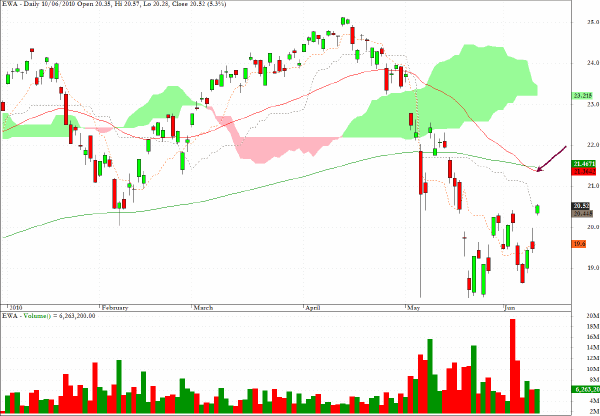
EWA, recommended here yesterday, gapped up on the open but managed a five-percent-plus move and may still have further to go towards the arrow indicated on the chart.
Clive Corcoran is the publisher of TradeWithForm.com, which provides daily analysis and commentary on the US stock market.
|