| Corcoran Technical Trading Patterns For June 15 |
| By Clive Corcoran |
Published
06/15/2010
|
Stocks
|
Unrated
|
|
|
|
Corcoran Technical Trading Patterns For June 15
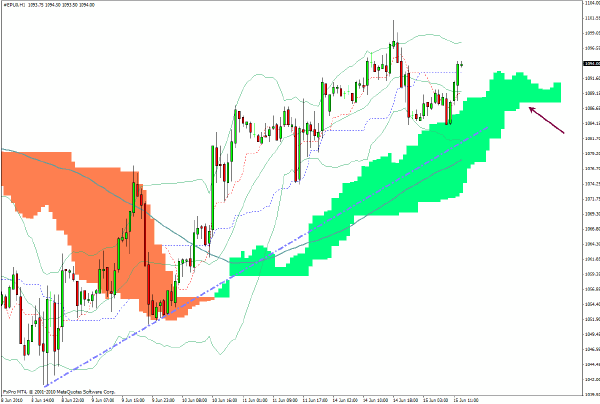
The S&P 500 ran into serious resistance at the 1100 level in yesterday’s session and eventually retreated towards the 1085 level where there is clear support.
At the time of writing, the futures have returned to the 1094 region which is really the pivotal level for the index and leaves the issue of the near-term direction unresolved.
The manner in which certain markets, including the euro and the S&P futures in European trading this morning, rallied so keenly after the announcement that Greek debt is now "officially" of junk status seemed just a little too much a case of traders proving how they had already discounted this "old news".
A sobering assessment of the political problems facing European leaders can easily be gleaned from recent developments in Belgium, Netherlands, and according to the Guardian newspaper, Angela Merkel’s coalition is being held together by a thread.
Perhaps the markets are under-estimating the fragility of the great European experiment!
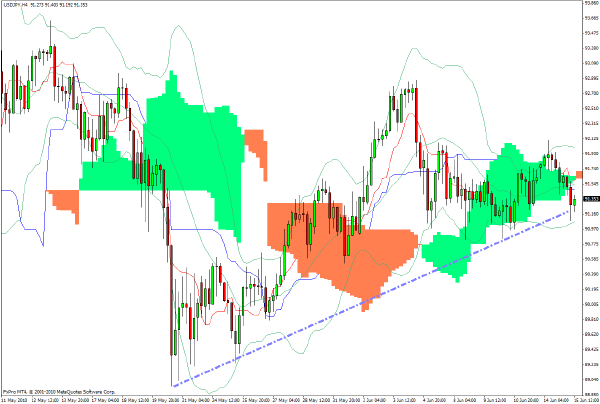
USD/JPY is at a fairly critical level in trading in Europe this morning. A break below the 91 level would take out a key trend line on the 240-minute chart and would also lend evidence to the hunch that the current flirtation with risk assets may be nothing more than promiscuity rather than a re-kindled and meaningful affair.
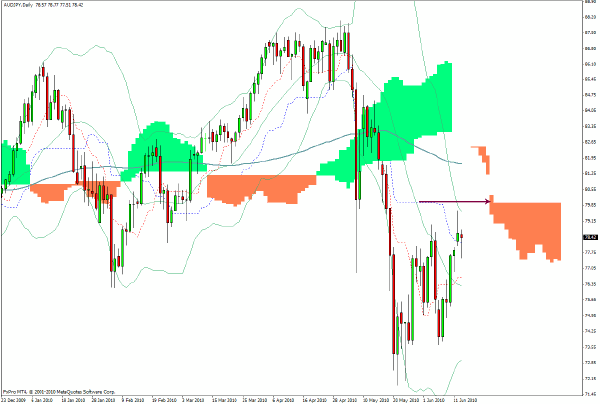
I will be a seller of AUD/JPY at the 80 level.
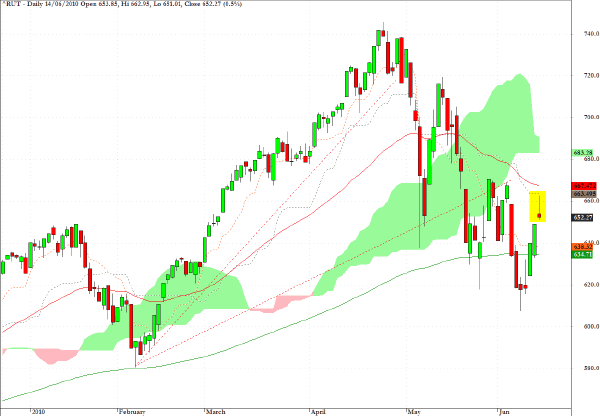
The candlestick formation on the chart for the Russell 2000 highlights the rejection at the 660 level which was discussed here last week. If equity markets are gearing up for a real rally as opposed to some algorithmically inspired inter-market shenanigans then one would expect to see some more vitality from the small cap sector.
A decisive close above 660 on this index would make me more persuaded of a short term bullish case for equities - at present I remain unconvinced with a leaning towards the view that all of the death crosses on sector charts are telling us something.
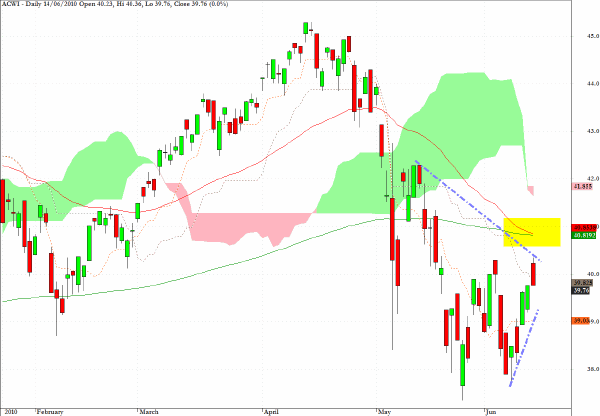
ACWI is an exchange traded fund which tracks the MSCI All Country World index, and it is one of many sector charts revealing the death cross formation i.e. where the 50-day EMA has crossed the 200-day EMA from above.
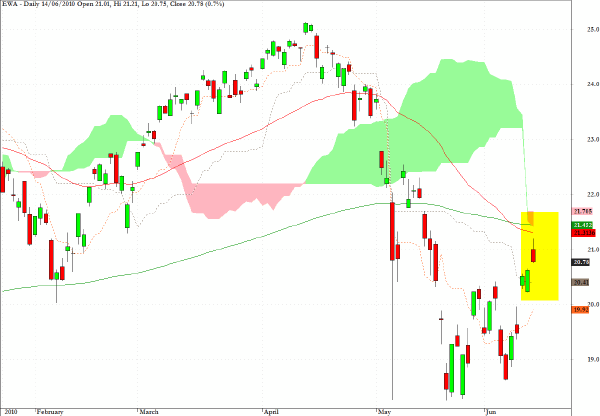
Last week I mentioned the following with respect to Australian equities.
EWA recommended here yesterday gapped up on the open but managed a five percent plus move and may still have further to go towards the arrow indicated on the chart.
In yesterday’s session, EWA went almost exactly to the arrow and then retreated - I will now be sitting on the sidelines with respect to this fund.
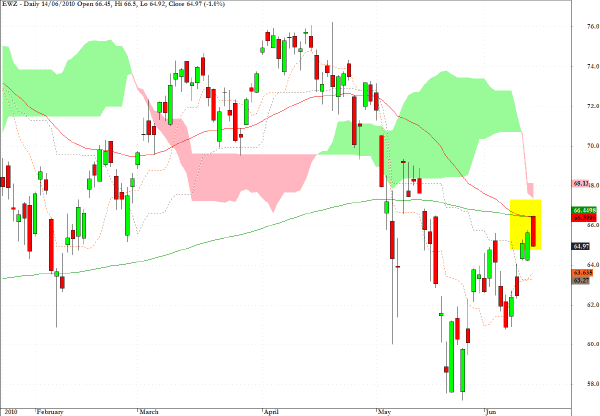
The chart for EWZ, which tracks the MSCI Brazil Index, also uncannily illustrates how the sector fund ran into resistance at exactly the point where the death cross manifested itself on the daily chart.
The BRIC sector fund, BKF, is also showing exactly the same feature.
Clive Corcoran is the publisher of TradeWithForm.com, which provides daily analysis and commentary on the US stock market.
|