| Corcoran Technical Trading Patterns For June 17 |
| By Clive Corcoran |
Published
06/17/2010
|
Stocks
|
Unrated
|
|
|
|
Corcoran Technical Trading Patterns For June 17
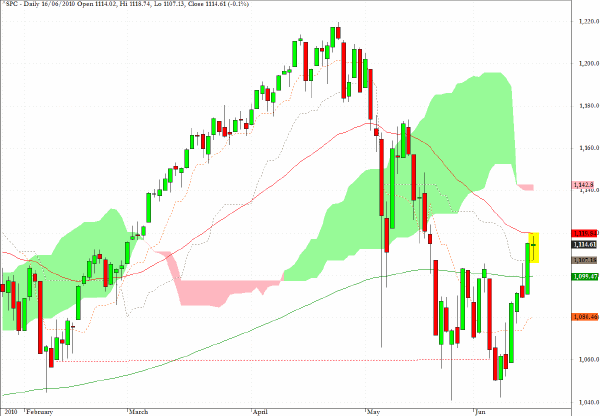
The S&P 500 managed to tip its hand in favor of the bulls as it pushed decisively above the 1100 level in Tuesday’s session and now seems to be ready to confront another key test at 1120 which is the level of the 50-day EMA which is just above the highlighted doji/hanging man candlestick formation which resulted from yesterday's trading.
My intuition is that there has not been a lot of enthusiasm behind the move up from the 1040 level, which itself was not really tested robustly, and that much of the move has been motivated by the relentless retreat of over-zealous short sellers when they smelled blood earlier in June.
Nonetheless, the short side of equities for the time being is likely to remain frustrating and I would only commit new funds to the short side of the S&P futures on a closing break below 1080.
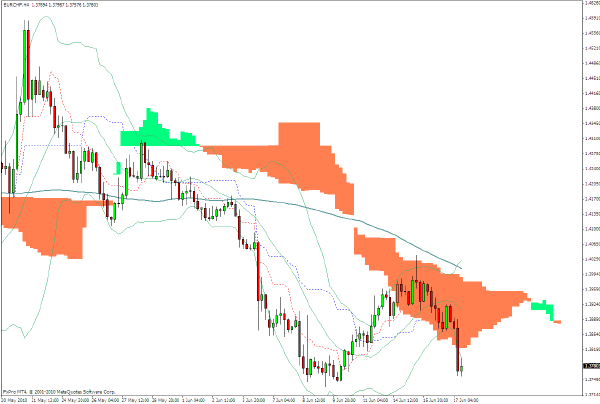
EUR/CHF is retreating to its lowest ever levels since the advent of the single currency and the long side has the characteristics of a relatively attractive risk/reward ratio.
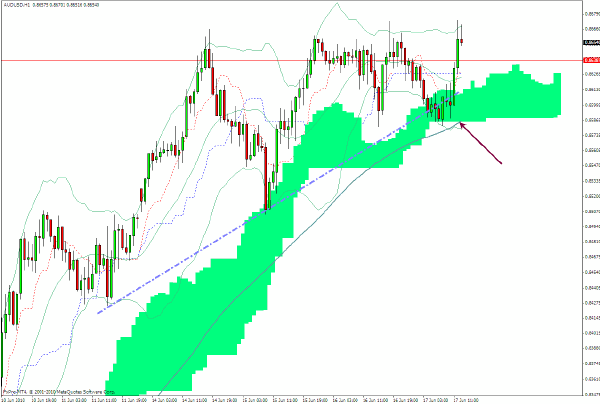
The Australian dollar - AUD/USD - seems to have stalled at current levels and the recent peek below the trend-line indicated on the chart and the cloud formation, could portend the beginning of a corrective move following the sharp rally since the late May and early June lows.
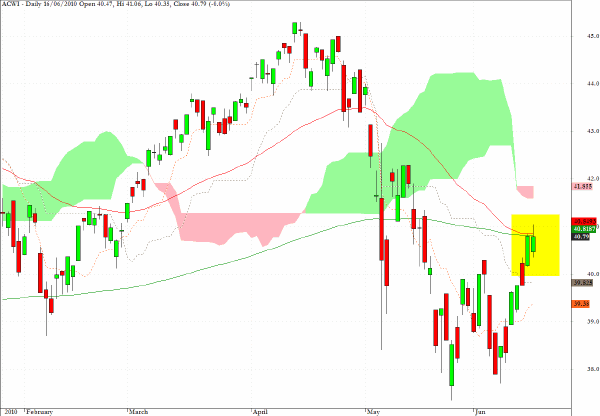
ACWI, is an exchange traded fund which tracks the MSCI All Country World index, and was discussed in Tuesday’s column. Yesterday’s close is still located at the point where the 50-day EMA has intersected with the 200-day EMA.
As one of the broadest asset indices, this chart indicates that the current market environment is one where the longer-term direction for equities remains at a cross roads.
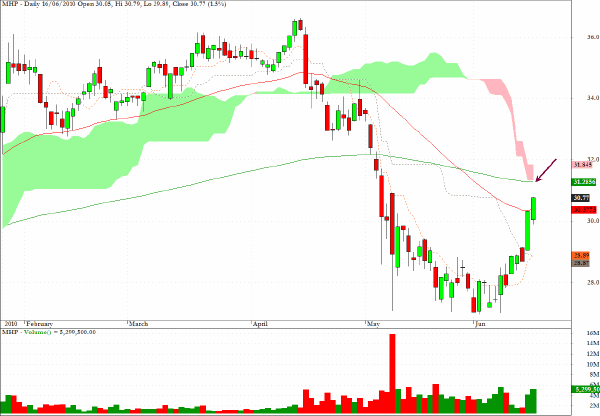
McGraw Hill (MHP) is likely to make a little more progress to the upside but I would suggest exiting at the point indicated by the arrow.
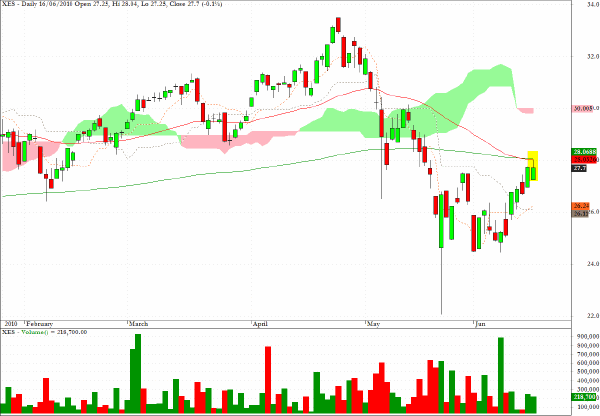
XES, an exchange traded fund for the Oil and Gas Equipment Sector, has also rallied exactly to the death cross level and expecting further upward progress in the near term, if one happens to be long this fund, looks risky.
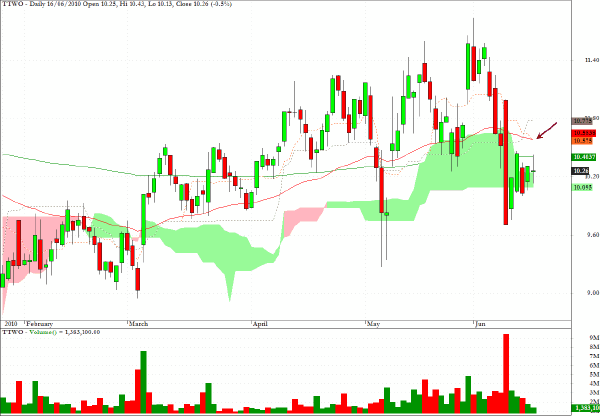
TTWO registered a doji star as it attempted to move above the cloud formation in yesterday’s trading and, in the context of the recent steep drop on very heavy volume, the suspicion is that the pullback phase may be completing in the near term.
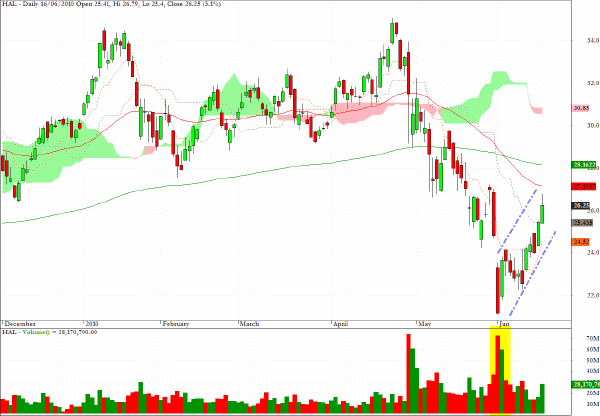
Haliburton (HAL) has a fairly well-defined bear flag pattern.
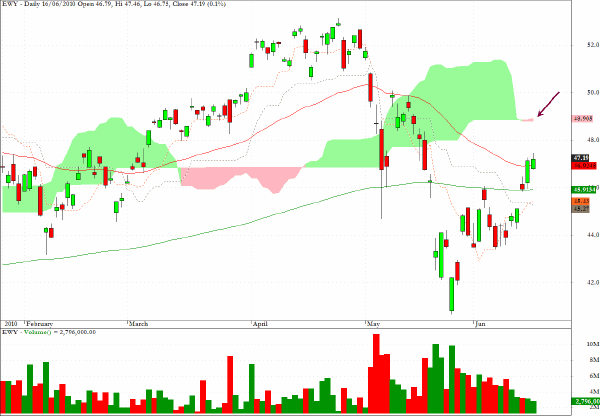
Of the many geographical sector funds which are tracked daily, EWY, which tracks the MSCI South Korea index, has a more positive tone than most. The Kijun Sen moved above the Tenkan Sen yesterday (for Ichimoku aficonados, there are explanations of all of these terms available with our premium subscription service) and the $49 level would seem like a feasible near-term target for 50% with a trailing stop on the remaining 50 long position.
Clive Corcoran is the publisher of TradeWithForm.com, which provides daily analysis and commentary on the US stock market.
|