| Corcoran Technical Trading Patterns For June 21 |
| By Clive Corcoran |
Published
06/21/2010
|
Stocks
|
Unrated
|
|
|
|
Corcoran Technical Trading Patterns For June 21
The opaque announcement over the weekend, prior to the G20 meeting in Toronto this week (surely just a coincidence) that the PBOC (Peoples Bank of China) is prepared to tolerate marginal adjustments in the exchange rate between the renminbi and the US dollar has been seized upon by equity bulls in Asian trading Monday and extending into the European session at the time of writing.
In particular the DAX is now above 6300 with a 1.3% rise although some of the enthusiasm appears to be waning.
Is the Chinese decision (if it in fact is a decision) a positive for risk assets and a step in solving global imbalances? According to perma-bull Jim O’Neill at Goldman Sachs it is. But to quote the old joke, Mr. O’Neill has never met any development in the BRIC nations that he didn’t like.
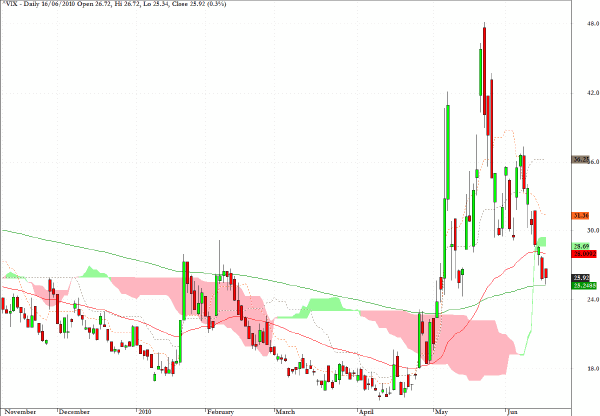
My concern is that US equity markets have already discounted a lot of very good news and been very ready to push doubts about the robustness of the global recovery aside. What better indicator of this than the descent of the VIX back to its 200-day EMA?
Although not featured today, the S&P futures at present are trading at 1126 which is a sizable move up from Friday’s close, but with some cloud resistance at 1134 on the daily chart there is a possibility of a gap and trap move today for US traders.
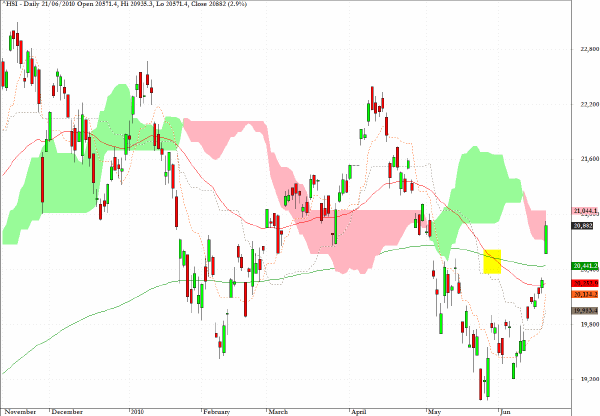
The Hang Seng index moved up more than 600 points on the PBOC announcement and should be able to test the top of the cloud formation at 21000. If the bulls can sustain this burst of energy then there is the possibility that the death cross highlighted in yellow could be reversed in coming weeks, but that remains, in my estimation, a big "if".
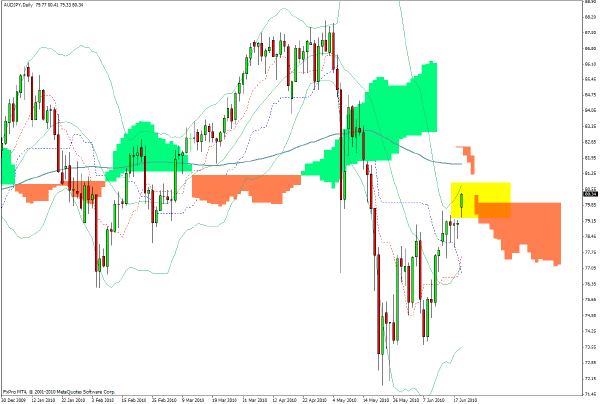
As mentioned here last week, since AUD/JPY has reached the target level of 80 I have been stalking entry points on the short side. The current action is an almost parabolic rise - which makes the timing of the entry more critical and I have just opened a short position at 80.65 and, since I favor this as a longer-term positional play, I will plan to add further to that as the day proceeds.
Since the Ichimoku chart suggests that a move towards 81.50 is possible in the near term, the clear evidence of a flat cloud top at 80 suggests that the risk/reward calculus favors the short side.
I would exit the accumulated position on a break above 81.60 which is a risk of 100 pips (more than I would normally use) as I believe the downside reward when it comes could be considerable.
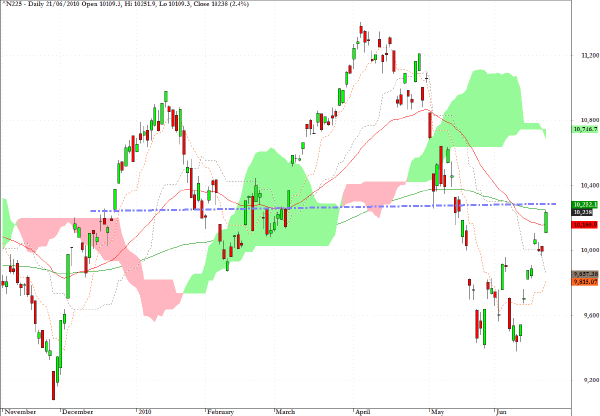
On the last occasion that I discussed the Nikkei 225 in this commentary, I proposed an upside target of 10,250 and that is almost exactly where today’s session closed. The close is exactly at the 200-day EMA and similar comments to those made regarding the Hang Seng apply with respect to the death cross on this chart. A move above 10,800 could reverse the paths of the two EMA’s but there is also the risk that in so doing the trajectory being followed would begin to resemble the right shoulder of a fairly well-defined H&S pattern.
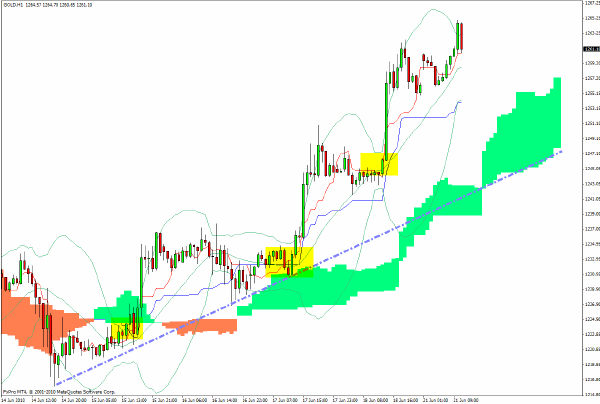
In line with my earlier remark that the VIX is beginning to indicate too much complacency, the chart for gold continues to act as a fly in the ointment for central bankers and policy makers. My sense is that the price of gold will track the rise in equities very closely and the swifter the rate of ascent of risk assets the sharper the rise in gold.
The dotted line on the hourly chart shows the key support line for the metal and it is worth noting how closely it follows the base of the green cloud. The $1340 target set here last October may not be too far off.
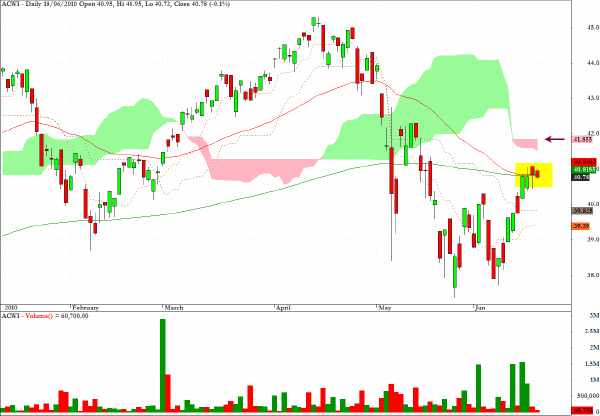
I would expect ACWI, the exchange traded fund which tracks the MSCI All Country World index, to reach up to $42 in today’s session but would then look to stand aside.
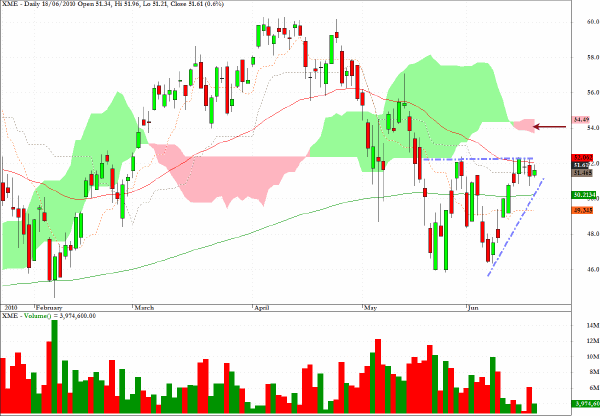
Based on the market’s reaction to the PBOC announcement, I'll stand by the call on XME made here last week.
From here upwards, the risk/reward ratio increases but if risk appetites are back in favor we could potentially see a move up to the cloud formation.
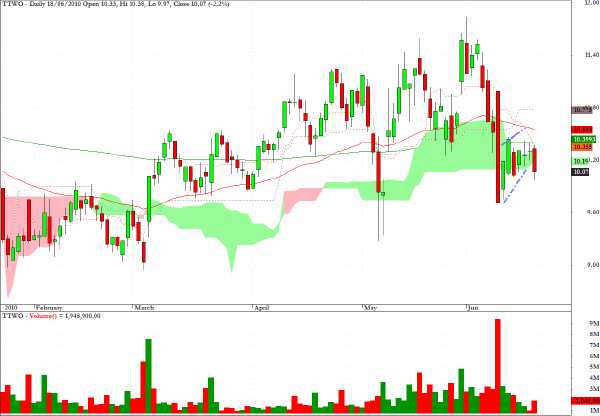
Last week the suggestion was made that for TTWO the pullback phase may be completing in the near term. Further weakness may lie ahead.
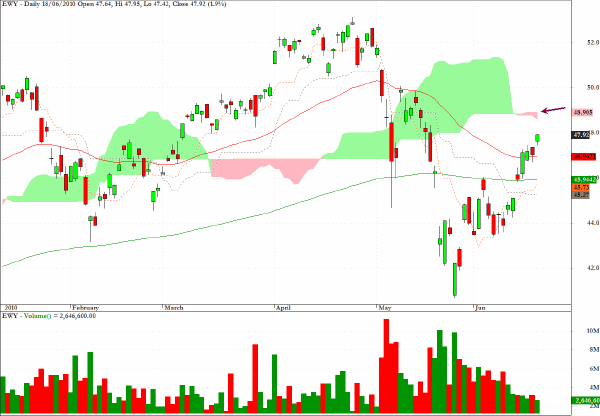
Again, as follow through to last week’s suggestions, the position for EWY is worth restating.
Of the many geographical sector funds which are tracked daily, EWY, which tracks the MSCI South Korea index, has a more positive tone than most. The $49 level would seem like a feasible near term target for 50% of the position with a trailing stop on the remaining 50%.
Clive Corcoran is the publisher of TradeWithForm.com, which provides daily analysis and commentary on the US stock market.
|