| Corcoran Technical Trading Patterns For June 24 |
| By Clive Corcoran |
Published
06/24/2010
|
Stocks
|
Unrated
|
|
|
|
Corcoran Technical Trading Patterns For June 24
The comments regarding the S&P 500 made here on Tuesday pretty much have matched exactly the progress of the index over the last 48 hours.
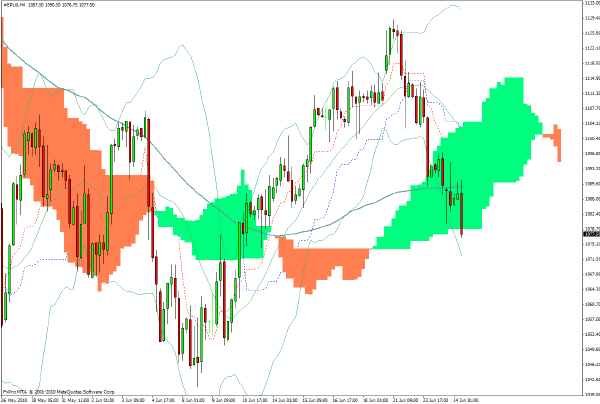
The 240-minute chart below showing the S&P futures at the time of writing (5am Eastern Time) on Thursday show that the 1080 level has been penetrated and this sets up the possibility that eventually the market needs to robustly test the 1040 region again (which it did only half-heartedly earlier in June).
The bears have had it their own way for the last three sessions and I would not be overly anxious to chase the market down at this point but rather to see the quality of any rebound towards the 1090 level at which point the short side would again seem more attractive.
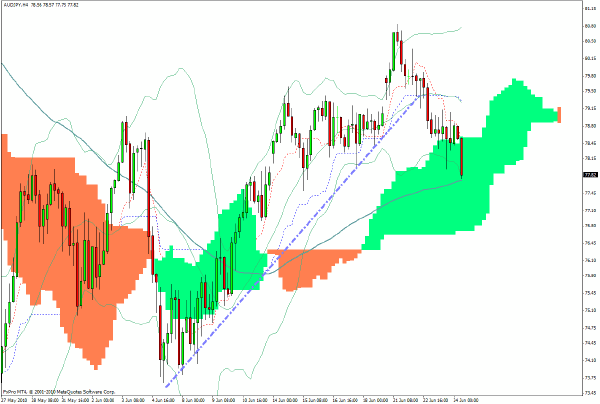
By touching the 100-day SMA located midway through the cloud on the 240-minute chart, AUD/JPY has satisfied my target for half of the position initiated earlier in the week at 80.65. With a gain of 280 pips, the trade has (at least so far) yielded a 2.8:1 reward to risk ratio as my stop loss from the entry risked 100 pips.
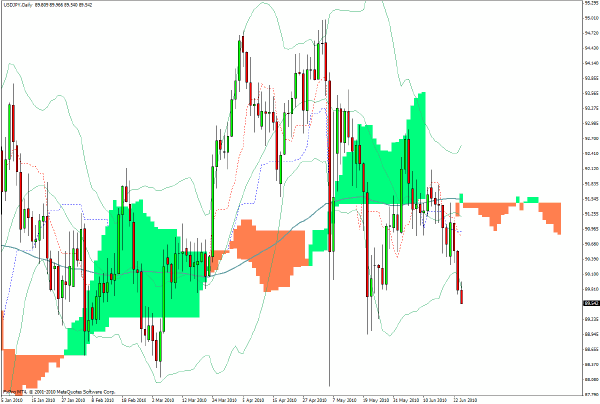
USD/JPY has paved the way for the retreat in risk appetite over the last few sessions. The break below 90.40 has brought the levels from May just above 89 in contention. Also possible is a retest of the May 6 low - the day of the flash crash - which reached down to 87.96.
As always, the strengthening of the yen has wide repercussions for the FX carry trade and recent action suggests that funds have been unwinding trades and de-leveraging in other risk trades.
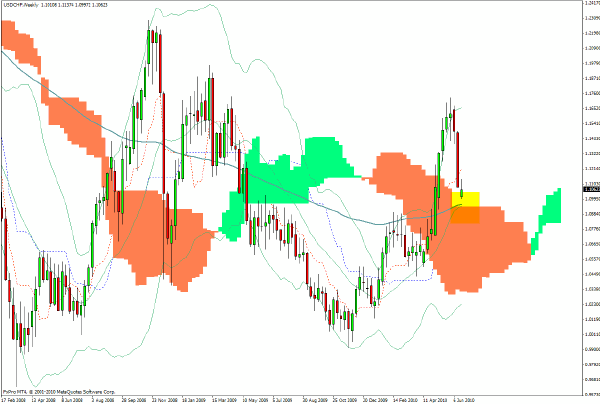
Looking from a longer-term perspective at the weekly chart of USD/CHF, it is evident that 1.0940 is a key support level for the US dollar against the Swiss currency. The long flat top of the cloud highlights illustrates that this level has been pivotal for the currency pair.
The question lingers as to whether the chart below indicates that this has already provided support or still needs further testing. The suspicion is that the latter is the case.
Based on the recently strong inverse relationship between global equities and the US dollar, it will be worth monitoring the USD/CHF pair for clues as to whether we are on the verge of another move up in the US dollar which will be associated with further weakness in US equity indices, or whether the rescue attempts to get the S&P 500 above 1100 again may prevail in the near term.
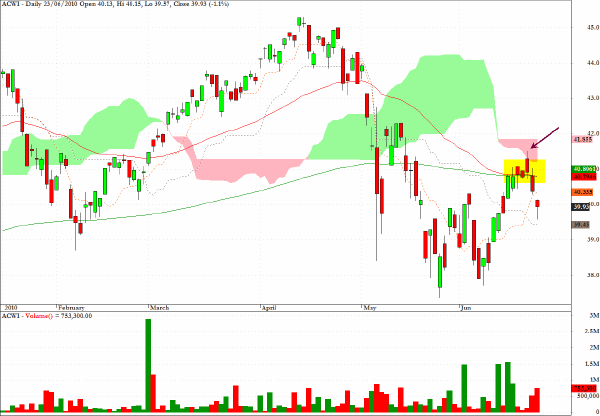
ACWI, the exchange traded fund which tracks the MSCI All Country World index, illustrates a common characteristic of many sector and index charts which is the confluence of several key levels.
The 50 and 200-EMA days are interwoven and the recent attempt for the index to maintain closes above the 200-day EMA shows that there is a fairly intense battle taking place between, the fact that many investors/asset allocators are clearly shunning equities at present, whereas there is a constituency which is keen to try to protect current levels lest the next shoe drops in the ongoing and ubiquitous process of asset deflation.
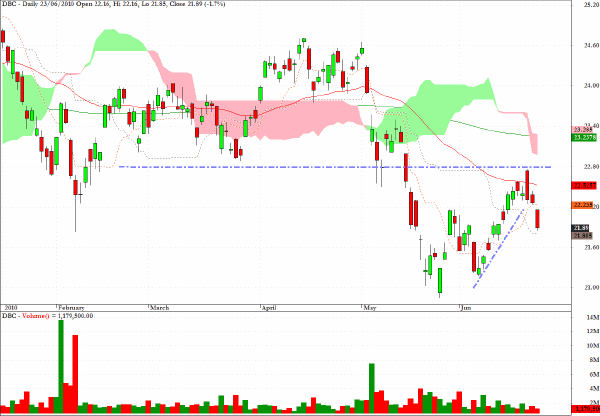
DBC, a sector fund tracking overall commodity prices, has fallen out of a rising channel after failing to reach up to the cloud formation just above a clear line of resistance at 22.80.
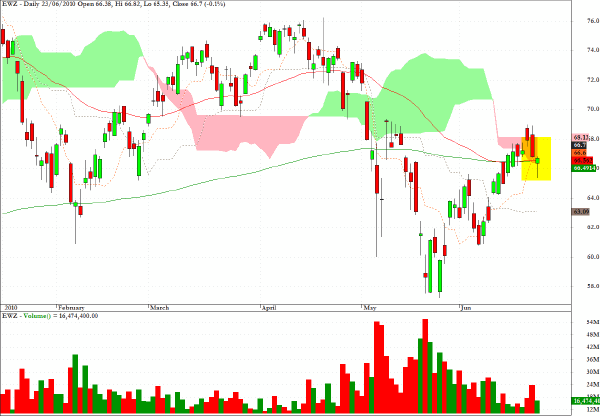
The chart for EWZ, which tracks the MSCI Brazil Index, bears a strong resemblance to the chart for ACWI and the fact that yesterday’s close sits astride the confluence of both the 50-day EMA and the 200-day EMA, as well as the bottom of the cloud, serves to underline that global equities are quite critically poised at present.
With this in mind, I would prefer to minimize exposure to equity indices for the time being, and monitor the developments in FX carefully, and wait for the directional uncertainty to be resolved before deciding on the appropriate stance and outlook regarding equities in the intermediate term.
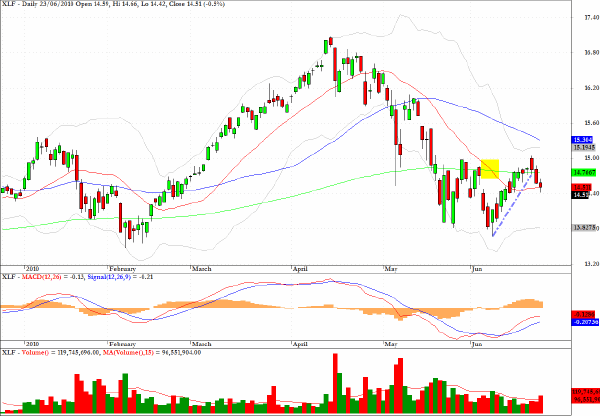
The daily chart of XLF, the exchange traded fund for the financial services sector, clearly reveals the break of the uptrend lines from early June which is seen on many charts.
No real comfort can be taken from the MACD chart segment and the February low seems to be a feasible target in the longer term.
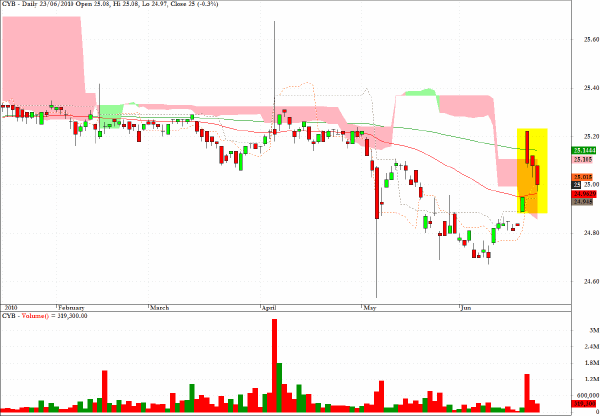
The stated objectives of the sector fund, CYB, are "to achieve total returns reflective of both money market rates in China available to foreign investors and changes in value of the Chinese Yuan relative to the U.S. dollar."
The fund is worth consideration in the light of recent news from the Chinese bank, but as the chart reminds us, the removal of the peg to the dollar means that both upward and downward adjustments are to be expected. Interestingly the last three sessions have seen strong volume and downward moves, which suggests that those who jumped in on Monday have been faded in yet another example of gap and trap .
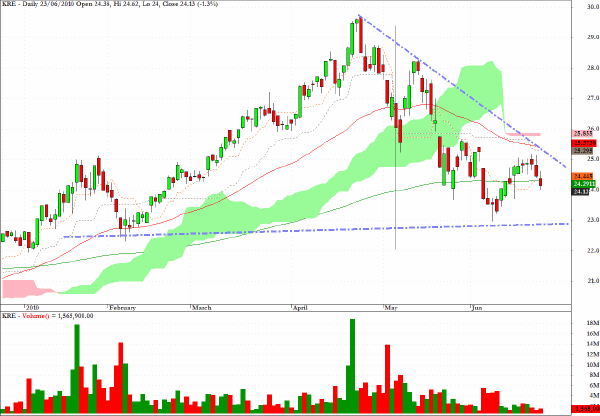
KRE, a sector fund which follows the KBW Regional Banking Index, shows a descending wedge pattern with a key support level at $23 which seems a likely target for testing in coming sessions.
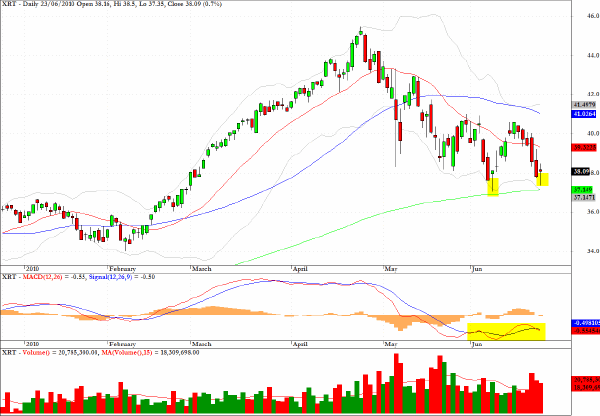
XRT, an ETF for the retail sector, has bounced twice off the 200-day EMA with hammer candlesticks, and with reasonably supportive MACD characteristics I would be looking for a move back towards the $40 level.
Clive Corcoran is the publisher of TradeWithForm.com, which provides daily analysis and commentary on the US stock market.
|