| Corcoran Technical Trading Patterns For June 25 |
| By Clive Corcoran |
Published
06/25/2010
|
Stocks
|
Unrated
|
|
|
|
Corcoran Technical Trading Patterns For June 25
Sometimes the next move for equities seems obvious - and that always tends to make me suspicious.
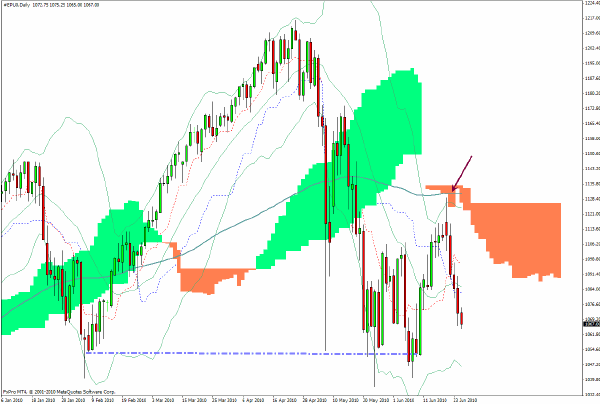
The S&P 500 futures are trading at 1068, near the electronic session lows, during trading in Europe this morning.
I have placed an arrow at the point where the mid-June rally would have been expected to run out of steam - and it did just that. Now we seem headed towards a test of the level indicated by the dashed line, and as seems likely a thorough test of the 1040 region. The question is, of course, what happens next?
Something tells me that a collapse would seem to be too unimaginative for those who specialize in the arcane maneuvers of inter-market arbitrage strategies.

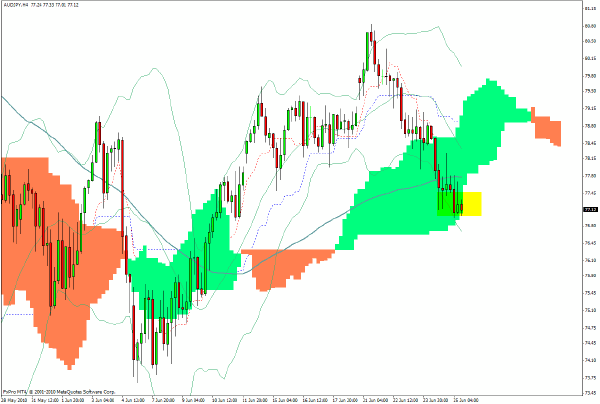
I have closed out my entire short position in AUD/JPY for the time being as the reaching of the bottom of the cloud satisfied my targets.
It may well be that a definite break below this level could see us headed toward the 75 level along with a little bit of panic as and when the S&P 500 reaches lower, but with more than 350 pips of gain in total on this trade this week it’s better not to overstay one’s welcome.

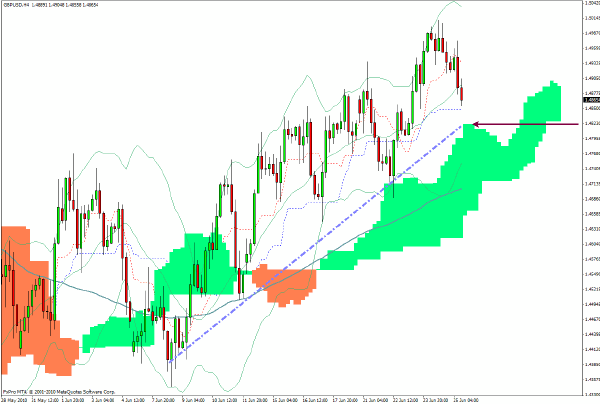
In early European trading sterling had a spirited attempt to move back towards a test of the $1.50 level and failed at around $1.4960. GBP/USD is one of my favorite FX pairs to trade, as surges upwards with a topping out before the target is reached are almost always a profitable signal to get short.
The first line of support would appear to be at the 1.4820 level as indicated by the arrow, with a reasonable chance that $1.4750 could be seen later today.

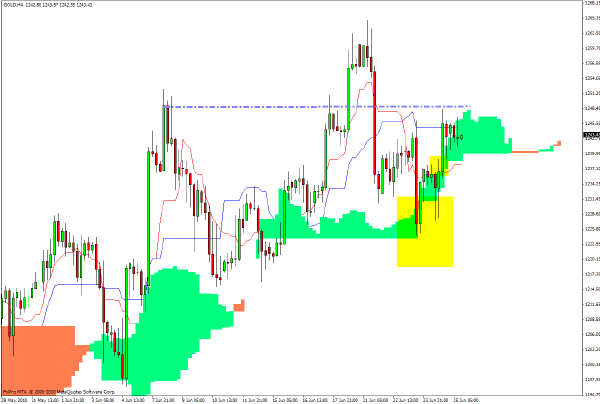
The 240-minute chart for spot gold illustrates the usefulness of using key Ichimoku levels to anticipate inflection points.
Earlier in the week there was a noticeable drop below a key trendline on the 60-minute chart and I would like to see the metal break above the dotted line around $1250 today. If it can, I suspect that we could see a quote with $13 as the first two digits before too long.

Clive Corcoran is the publisher of TradeWithForm.com, which provides daily analysis and commentary on the US stock market.
|