| Corcoran Technical Trading Patterns For July 6 |
| By Clive Corcoran |
Published
07/6/2010
|
Stocks
|
Unrated
|
|
|
|
Corcoran Technical Trading Patterns For July 6
I was away from my desk most of last week but had the chance to check big picture developments in the markets and also to digest the mounting evidence that the much heralded Keynesian stimulus panacea seems to have lost its applicability in a world that is swimming in debt.
Technically, equities look vulnerable and fragile and a major move downwards is an omnipresent possibility. Having said that there is always some reason to doubt that when everyone is talking about a head and shoulders top formation that it should give way without a serious preservation of composure effort by those who still firmly maintain that a global economic recovery is under way, albeit a subdued one. The single factor that may keep a bid under equities for the next couple of weeks is the announcement of Q2 earnings. But attention will be as much focused on the quality of the earnings as on the outlook statements that accompany the reports.
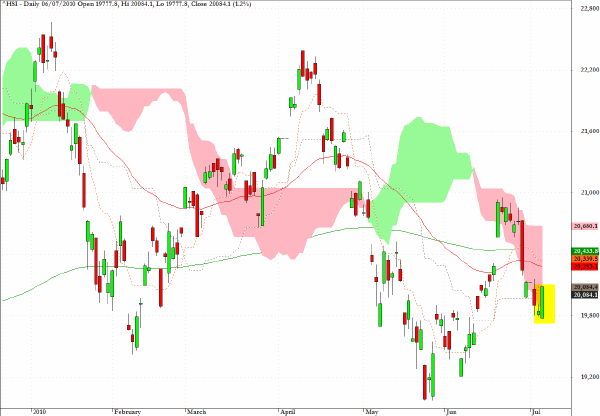
In Asian trading on Tuesday, the Hang Seng Index (HSI) managed to register a classic green trend day, opening on its low and closing on its high for the session. As the chart below suggests, the action brought the close back into the cloud formation and it is conceivable that a test of the 200-day EMA midway through the cloud at 20,430 is the next target, but I would be surprised to see the top of the cloud at 20,680 penetrated.
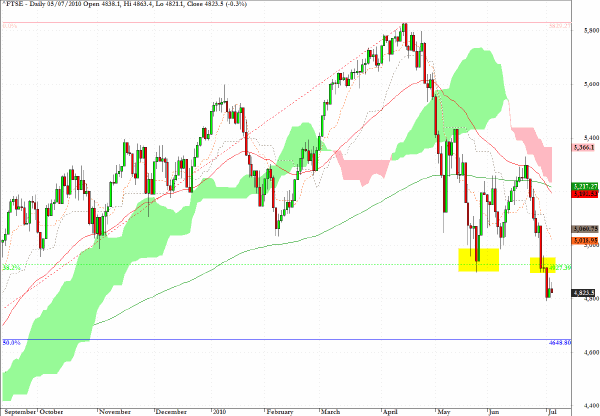
European markets were open yesterday but were quiet given the fact that the US was closed for the Independence Day holiday. The UK’s FTSE 100 has continued to slide and as can be seen on the chart there is some attempt to hold around the current levels near 4800, but this is below the 38% retracement of the March 2009 low up to the mid-April high, which is situated at 4930.
The 4650 level, which is the 50% retracement level, would seem to be a feasible target in the intermediate term but, in line with the qualification provided above regarding a wait and see approach during the Q2 reporting season, a further substantial move down may not come until the 4900-5000 level has been tested.
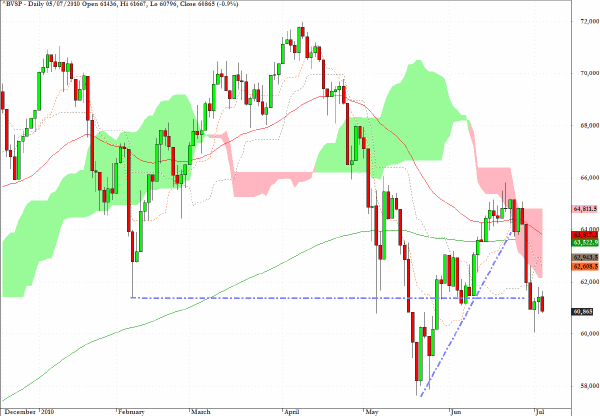
The Brazilian market also traded on Monday and, as can be seen on the chart below, the almost one per cent drop keeps this key emerging market at a critical level just above 60,000 and at potential resistance from the previous support level seen in early February.
For those asset allocators who remain positive about the intermediate outlook for equities, this market would need to break above 65,000, in my estimation, to counter the negative consequence of the crossover of the 50-day EMA below the 200-day EMA which occurred yesterday.
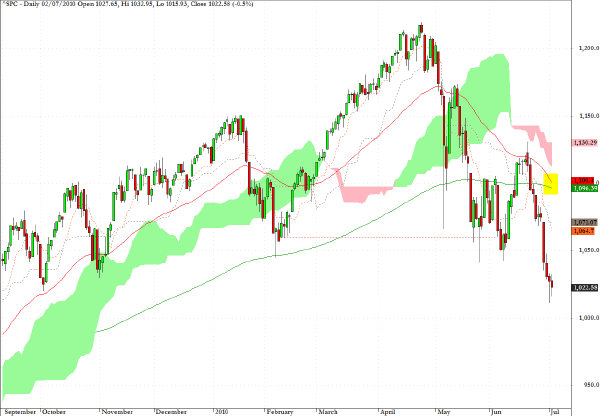
The S&P 500 is hanging on by its fingertips having decisively broken below the 1040 level which I discussed here many times prior to my vacation last week.
In electronic trading in Europe the futures are mounting a rally and currently sitting at 1025 but there are some negative divergences on this morning’s futures chart and it would seem likely that when US traders return from their long weekend there might well be downside pressure to test just how much conviction there has been in the drift upwards since last Friday’s US close.
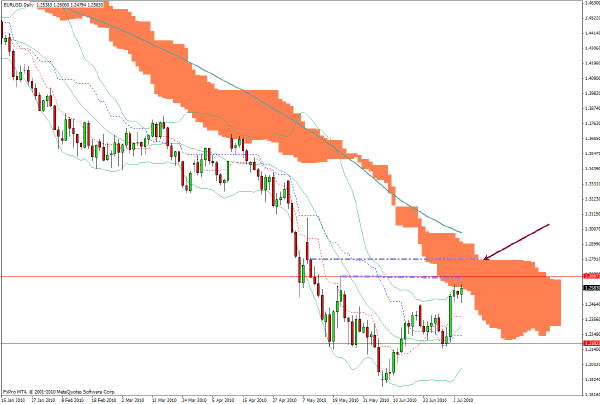
I have not discussed EUR/USD for some time as the expected bounce back, which is definitely counter-trend in terms of the larger picture, has confined my trading to short-term opportunistic trades on both sides of the market.
There is scope for further upside, and I would suggest there are two higher targets indicated on the chart below. The first at $1.2660 is a more immediate target where I would look at a relatively short term opportunity to get short with a stop loss at $1.27 and a target of $1.2385. If the euro can move above $1.27 then I would suggest that $1.2780 would represent a much more formidable hurdle (the flat top of the cloud on the daily chart) and provide an entry level for a more aggressive short position with similar target as before.
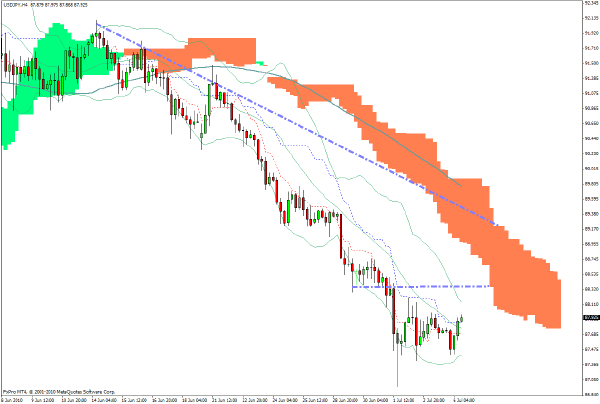
USD/JPY was one of the leading indicators for the rush out of risk assets last week and the 240-minute chart below shows that there may be a continued short-term rally but the thick cloud formation should present strong resistance on the upside.
If we were to make it to 88.50 in today’s session, I would favor the short side again.
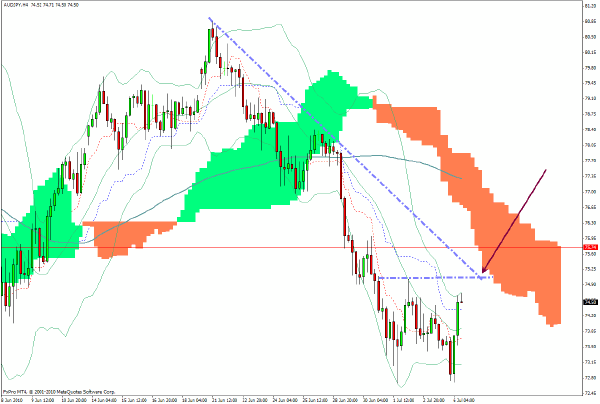
AUD/JPY acts like a barometer for the overall market in risk assets and the decline after the pair reached back to the 80 level, which I discussed in early June as the point to get aggressively short, was a very rewarding trade. In last week’s actions the pair exceeded my expectations on the downside which I had targeted at 75 but where 72.80 was touched twice.
In the near term I would stand aside but look at re-instating short positions around 75.85 with a target of 200 pips and a risk of 100 pips.
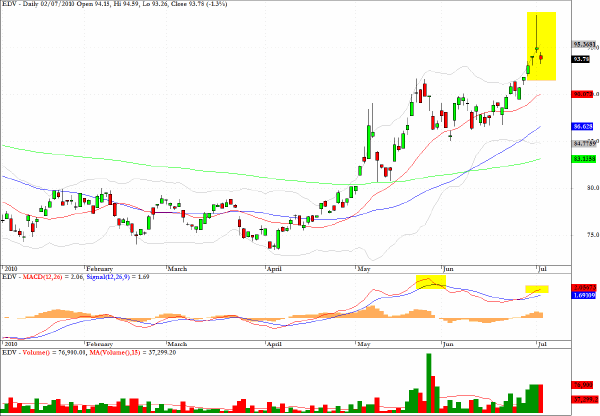
The exchange traded fund EDV represents a play on long-term Treasury prices, and is clearly indicating a topping pattern in the near term.
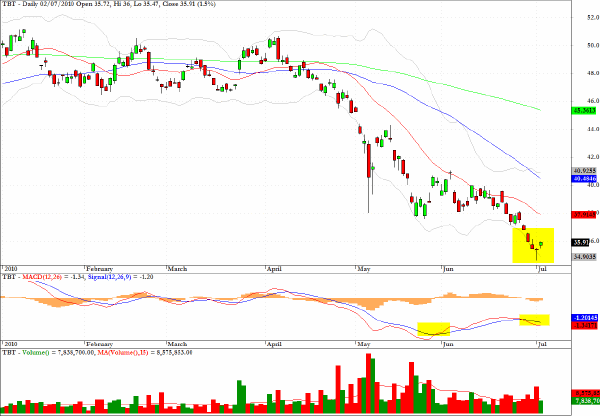
The chart for TBT, which moves in tandem with increased yields on long-term US Treasuries, is acting in accordance with the diagnosis provided above for EDV as there is a case to be made for a near-term bet on increasing yields on the long end of the Treasury market. However, I would keep this position under review and trade nimbly as any upset in equities will reinvigorate the flight to safety dynamics.
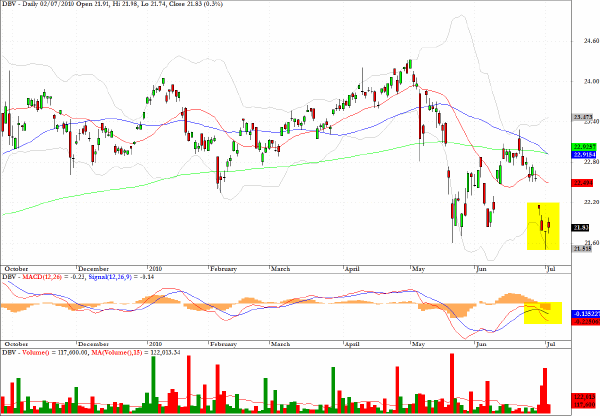
One way of playing the retreat in the US dollar, which probably has some way to go still, would be a long position in DBV which is an ETF which represents a basket of long futures positions in G10 currencies and which, as suggested by the chart, below appears to have upside potential towards $23.
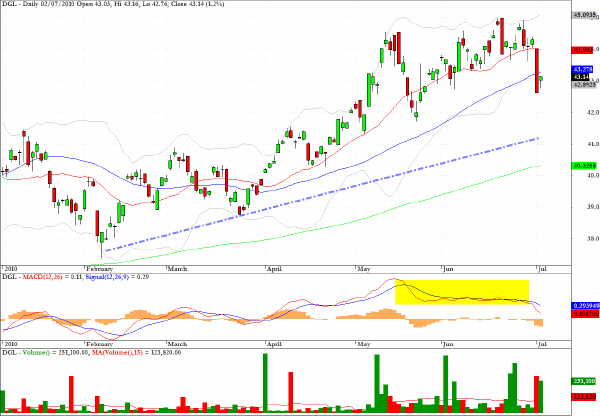
The chart for the exchange traded fund, DGL, which represents a two times leverage position in gold is showing signs of technical weakness which, in the near term, could see a test of the trend line that has been drawn on the chart.
Clive Corcoran is the publisher of TradeWithForm.com, which provides daily analysis and commentary on the US stock market.
|