NASDAQ Commentary
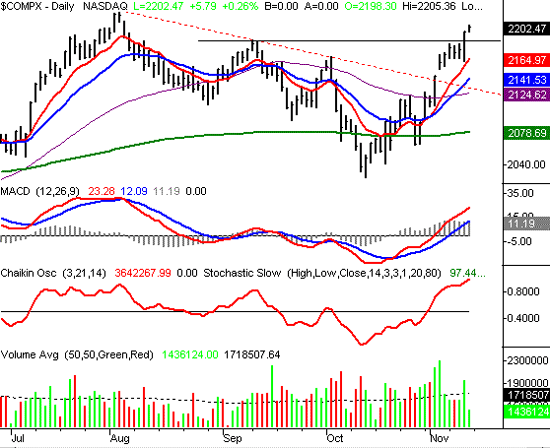
The NASDAQ Composite rallied to 2202.47 last week for its third consecutive weekly gain. That 33 point addition over the prior week's close was good for a 1.5% gain, and leaves the index knocking on the door of a new 52-week high. Overall, that's bullish, but we still see a little too much froth that needs to be burned off before we can really make a big upward move. The question is, does the rest of the market see it too? Despite its vulnerability, it now looks like the market could go parabolic in the short run......if we can make it past one last hurdle.
That last hurdle is indeed the previous 52-week high of 2219.91, which we hit in early August. After last week it's less than 20 points away, so we'd be the first to acknowledge that the breakout potential is tantalizing. However, a closer look at the chart shows a massive separation between the 20-day (blue) and 50-day (purple) moving averages lines, and even a pretty big gap between the 10-day line (red) at 2165. The issue is just one of healthy growth versus unhealthy growth........the latter usually results in a pullback of at least a moderate size. And in particular, we've seen far too much back-and-forth this year to think that this rally can be sustained without being questioned.
The final test, though, will be what happens once we get up to the 2220 mark. That could be resistance, and the reversal point. Or, if the NASDAQ manages to break above it with at least a little conviction, that could inspire even more buying. If that happens, there's really no major resistance left, so there's no telling where such a rally could stop. (We'd probably use sentiment tools to spot the top then.)
In the meantime, here's how we're playing it......we think the composite has enough juice to get up to 2220, even though it's dangerously overbought. Once there, we'll reassess. If we can get a couple of closes above the 2220 level, we'll look for another leg higher. The only question you'll have to answer is whether or not the next 20 points are enough to trade. If it is, great, but a lot of folks are waiting to see where things go after we get to that pivotal level.
NASDAQ Chart

S&P 500 Commentary
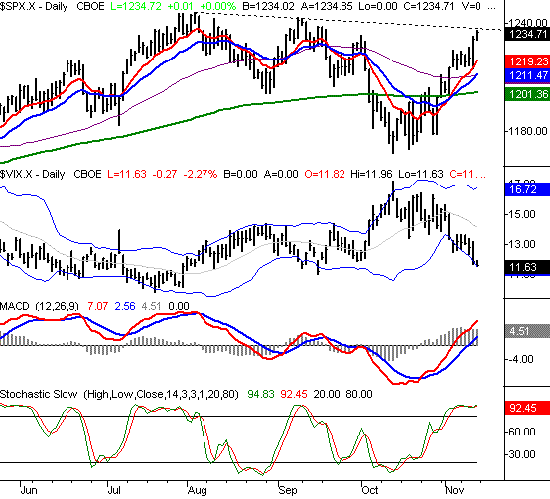
The chart of the S&P 500 looks pretty much like the NASDAQ's, although there's an additional immediate issue the S&P 500 is facing. Overall, the S&P's 14.5 point gain last week is bullish, as is the fact that the index recently crossed above all of its key moving averages. But, between the VIX creeping down into excessively low levels, and the fact that SPX is waaaayyy overbought (stochastically), this chart is also very vulnerable.
The added issue here, though, is that fact that the S&P is right at a resistance line (dashed) that extends back to August's 52-week high. This is an immediate (as in Monday) concern. The momentum looks red hot right now, but we've seen this all year long......things turn south right when it looks like they can't go anywhere but north. And even if we do manage to break past that resistance at 1236, we're still under the 52-week high of 1245.86.
Like the NASDAQ, the S&P's new 52-week high mark is within striking distance......about 10 points, in this case. That small amount of ground can be covered in a day or less, so we expect to have an asnwer to this question pretty soon. If we do manage to make a couple of closes above 1246, then we'll have enough evidence to get bullish. But the fact of the matter is that the SPX chart is technically ripe for a fall (much more so than the NASDAQ).
Any fall, however, should be limited. The worst case scenario we can see would be a pullback all the way to the 200 day line at 1201. And really, the market would probably catch itself before it even gave up that much. The more likely landing point for any dip is the 20/50 day lines, currently at 1211 (that said, the 10 day line was verified as support too, on Thursday). Once - or if - that support is found, we expect to see this renewed bullishness resume, and we're looking for a strong close to the year.
In the meantime, if the S&P 500 can break to a new 52-week high, that may be just enough to help everyone forget how overbought the market is at this point. If that happens, expect to see another runaway bull surge. That kind of rally would be more dangerous, as its end would be unpredictable. But, that kind of explosiveness can greatly reward the players who can stomach it.
S&P 500 Chart

Dow Jones Industrials Commentary
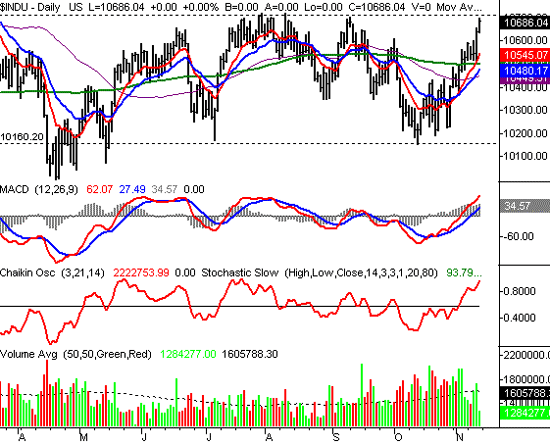
Last week, the Dow's close at 10,686.04 represented a 1.5 percent improvement from the prior week's close at 10,530.76. Those results are basically in line with other charts, and in terms of momentum alone, that's bullish. However, the Dow is also at a pivotal make-or-break point, but not because it's on the verge of a new 52-week high.
The issue here is the trading range we mentioned in a prior update. The upper edge is at 10,720, while the lower edge is around 10,160. Obviously last week's close at 10,686 leaves the index on the verge of a breakout, but we've been here before.....and failed to move higher both times we had the chance to hurdle this line. So, we're skeptical for obvious reasons.
That said, there is one key difference between now and then. On the last two approaches to 10,720, the Dow was already either decelerating, or lacked enough volume to really get a rally going. This time, neither is the case. We can actually see the Dow is accelerating into this resistance, and we can also see that bullish volume is growing. This scenario presents the best chance for the Dow to break through that resistance line.
If it does, the next stop is then the 52-week high of 10,984. If not, we don't think the pullback will go any lower than the 200 day line at 10,502.
Dow Jones Industrials Chart

Price Headley is the founder and chief analyst of BigTrends.com.