One of the few remaining charts that has continued to trend higher over the past few months, other than bond ETFs TLT and IEF, is the iPath S&P 500 VIX Mid-Term (VXZ).
Stocks returned from the long holiday weekend with a promising start, as the major averages gapped more than 1% higher across the board on the open. We saw some encouraging signs during the first hour of trading, as the averages were able to hold the morning gap and break out to new intraday highs after 10:00 am. However, despite the positive morning action, there were no buyers to be found, as stocks steadily declined through the afternoon and erased all the early gains and more. A bounce into the close allowed a few of the averages to finish in positive territory, just below the middle of the day's range. The Dow Jones Industrial Average and S&P 500 held up best, posting gains of 0.6% and 0.5% respectively. The Nasdaq Composite just barely held on to a 0.1% gain. The S&P Midcap 400 lost 0.3%, while the small-cap Russell 2000 sank 1.5%. Since the swing high of June 21, the major indices have failed to produce much more than a three or four-hour rally intraday before hitting a brick wall.
Total volume finished well above the prior day's level on both exchanges. NYSE volume came in 19% higher, while Nasdaq volume increased 30%. Market internals got off to a great start during the first hour of trading, with advancing volume beating declining volume by a 13 to 1 margin on the NYSE. However, confirming the breakdown in the price action, the NYSE a/d ratio completely reversed and dipped into negative territory before closing slightly positive at 1.2 to 1.
One of the few remaining charts that is trending higher over the past few months (other than bond ETFs TLT and IEF) is the iPath S&P 500 VIX Mid-Term (VXZ): 
If VXZ continues to back off the recent swing high over the next few days, then we may see a potential pullback entry develop around the 20-day exponential moving average, somewhere in the 90.00 - 92.00 range. There is also support from the 50% Fibo level around 91.15 (measured from the 6/21 low to 7/1 high). An ideal buy setup would be something along the lines of a one or two-bar shakeout beneath the June 29 low and the 20-day EMA, followed by a quick reversal back above the 20-day EMA.
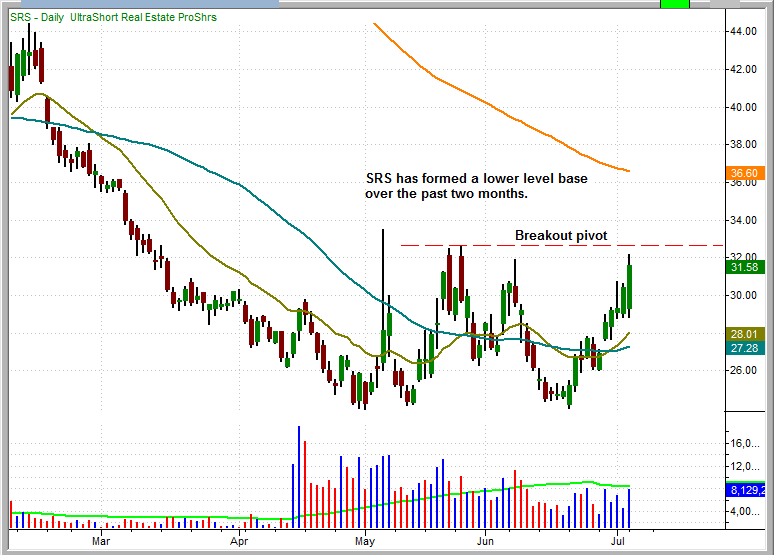
Ultrashort Real Estate Proshares (SRS) is a potential trend reversal candidate. The weekly chart below shows the 10-week moving average starting to turn up over the past two weeks, while it is forming a two-month base at the lows. 
If we drop down to the daily chart we see the breakout pivot level at 32.68. SRS still has quite a bit of work to do before we see an clear reversal of trend. A breakout above the range may be too obvious of a setup, so one may look for a pullback entry prior to the breakout or after the breakout to establish partial size. If VXZ attempts to breakout and fails, then any pullback below 32.00 into a rising 20-day EMA may also be a low risk entry point. 
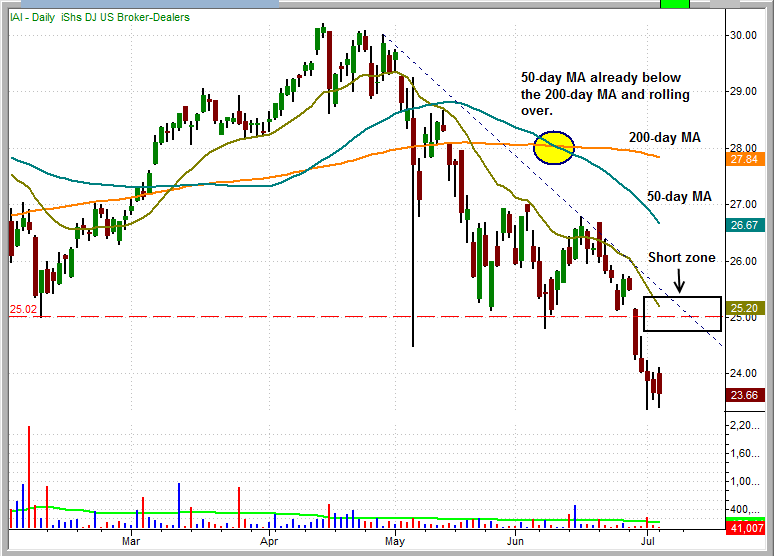
The ishares Dow Jones Broker-Dealers (IAI) recently broke an obvious support level at 25.00. The 50-day moving average has already crossed below the 200-day moving average, which is a bearish, moving average crossover signal known as the "death cross". If the market rallies higher sometime this week or next, then IAI may setup on the short side with a bounce to the 25.00 - 26.00 area, where there is resistance from the downtrending 20-day EMA, prior swing lows, and the downtrend line. 
Open ETF positions:
Long - TLT, UNG, DBA, UUP
Short (including inversely correlated "short ETFs") -
Deron Wagner is the Founder and Head Trader of both Morpheus Capital LP, a U.S. hedge fund, and MorpheusTrading.com, a trader education firm.