If the diagnosis that risk is back in favor is correct, the place to be in equities could be the small caps as their higher beta will deliver the most accelerated upside returns.
The double bottom on USD/JPY and the breakout from congestion in the 87.70 area highlighted on the hourly chart should provide a supportive environment for more progress in equities and risk assets in general.
The danger is that the quant funds will get ahead of themselves and the algos will move indices too fast without an adequate liquidity cushion.
It would be safe to assume that there will be air pockets to keep the ride interesting. 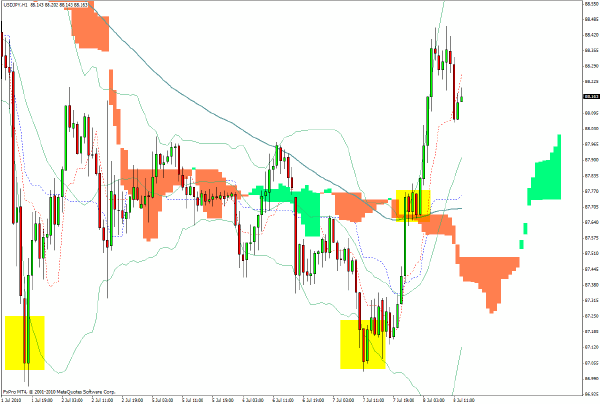
The S&P 500 futures took off with a vengeance yesterday after it became evident that some large macro funds had successfully engineered a critical test of one component of the FX carry trade.
At present there is a challenge from the cloud and the 100-period SMA on the chart below so there could be some "profit taking" as they like to refer to it in the mainstream media.
In the intermediate term, 1090 seems like the real test for the bulls. 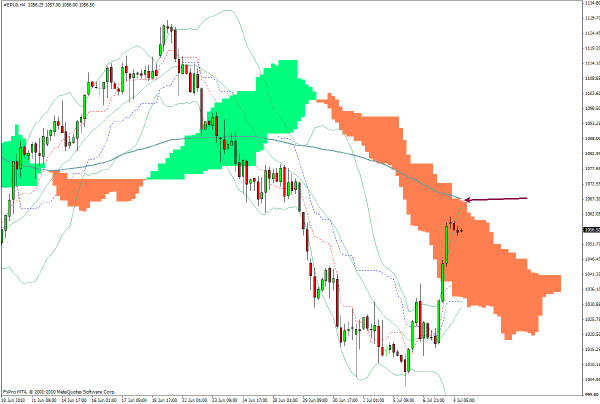
There was palpable relief in Tokyo trading overnight that the yen had stopped rising and the Nikkei 225 managed a 2.8% rise.
Reviewing the chart, it is hard to make too much sense of recent action other than the fact that the recent retest of the November low could prove to be a platform for upward progress towards the cloud formation. 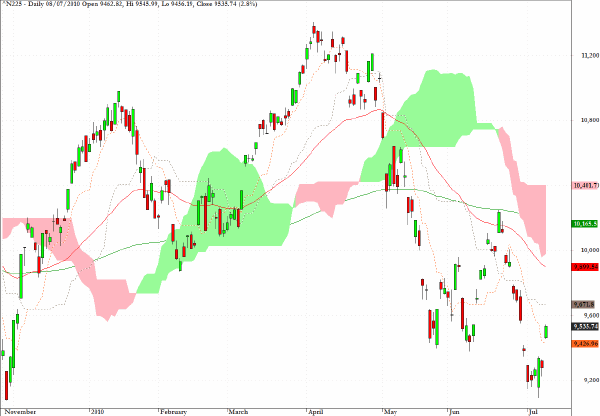
If the diagnosis that risk is back in favor is correct, the place to be in equities will be the small caps as their higher beta will deliver the most accelerated upside returns.
The 650/600 level is a feasible intermediate term target on the Russell 2000 (i.e. in the next few days). 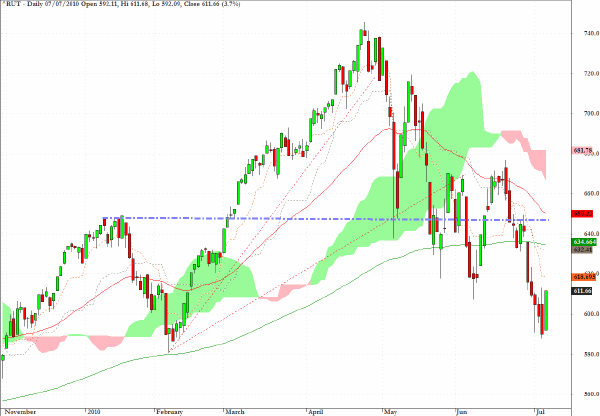
IWM is the exchange traded proxy for the Russell 2000 and a spread of long IWM and short DIA would be worth considering as the Risk On dynamics return to the market.
One cause for not getting too aggressive yet was the rather anemic volume registered on this ETF yesterday. 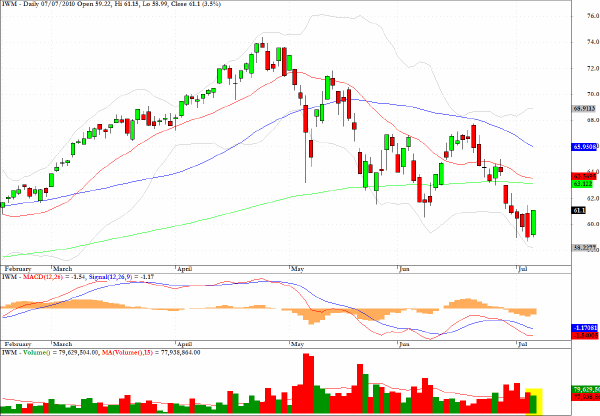
Banks were one of the main beneficiaries and the KBW Banking index moved up more than 5% yesterday.
According to research which I am currently doing for a new book on Inter-market Trading techniques, the correlation between daily changes in the AUD/JPY cross rate and XLF is one of the highest, with an R squared value of 0.66 since the beginning of 2010.
If none of that makes any sense then there will be a good reason to buy the book! 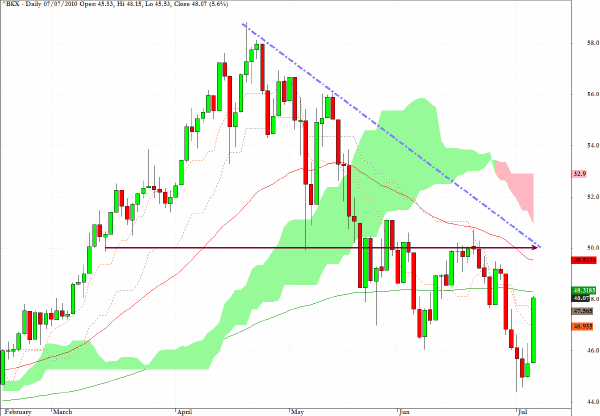
I'll simply repeat my remark from earlier in the week in the light of the growing appetite for risk.
The exchange traded fund EDV represents a play on long-term Treasury prices, and is clearly indicating a topping pattern in the near term. 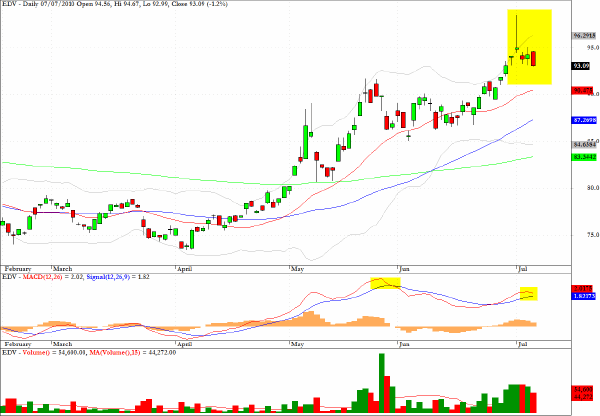
Clive Corcoran is the publisher of TradeWithForm.com, which provides daily analysis and commentary on the US stock market.