| It's More Than Just Birth-Death |
| By John Mauldin |
Published
07/11/2010
|
Currency , Futures , Options , Stocks
|
Unrated
|
|
|
|
It's More Than Just Birth-Death
Just how dynamic is the US job market? If I told you we created over 4 million jobs in April, would you believe me? I had a long conversation with Mohamed El-Erian of PIMCO yesterday. He is openly speculating that employment may no longer be just a lagging indicator but may also be predictive. It is an interesting insight, which we will explore as we take a very deep look at US employment. And I answer a few questions about my thought that there is a 60% chance for a recession in 2011, and why there is a 40% chance we won't. What could change those numbers? We explore that and more, while I suffer from the injustice that LeBron will play with Wade and Bosh. Where's a nonproliferation treaty when you need it?
It's More Than Just Birth/Death
Last week, I wrote about the Birth/Death Adjustment in the Bureau of Labor Statistics monthly employment numbers. Jeff Miller took me to task in his blog for not noting that the B/D numbers are not seasonally adjusted (which I know) and a few other items. I did some research on his work on employment numbers and came away with a few new thoughts that I think are worth sharing. Miller (a former professor and a nice guy) and I spent several hours on the phone talking about the BLS data and what he sees as an unusual divergence in the data, which I agree is far more interesting than the B/D Assessment.
To get to the interesting part, I am going to risk boring you with a few wonkish background paragraphs. First, let's look at the basic process of how the BLS does its survey. Basically, the BLS tries to count every job in the US every month. They survey 140,000 businesses and governments representing about 410,000 worksites each month. It takes a while to get companies to respond. You get about 60% on the first round, another 20% the second round, and another 10% the next time. That is why there are revisions each month to previous data as the BLS gets more accurate info. And since the revisions represent a significant number of businesses, the direction of the prior month's data revision is often more important than the current number.
But that also means that the BLS must make an estimate concerning the other 10% who did not respond. They more or less assume that those who didn't respond are statistically like those who did. One of Miller's points is that this estimated number is far larger than the B/D Assessment.
It's a Seasonal Thing
The non-seasonally adjusted number for any given month is a VERY noisy, volatile number. If that number made the headlines it would cause massive rejoicing or heart attacks each month. Let's look at just how volatile it is.
First, there are about 130 million employed people in the US. Every month we get a report called the JOLTS report (the Job Openings and Labor Turnover survey) on data a few months old, which is mostly ignored because it is "old" data. Last June 8, we got the data for April. There were 3.1 million job openings, up from 2.5 million a year ago. 4.3 million people found jobs and 4 million either voluntarily left or were laid off. In one month. And that pretty much has been the case every month for the last year or so, but note that the number on the positive side of the ledger is down a million from what it was a few years ago. Remember, this is not net job creations we are talking about, just activity.
On a non-seasonally adjusted basis, in January 2010 we lost 2.8 million jobs (January is always a big loser). In April and May we created 1.1 million jobs each month. And then there were the 1.5 million we lost last July or the 224,000 we gained last April while we were still in recession. September and October saw a combined 1 million jobs, November was plus 80,000, while December shed 521,000.
Like I said, it's all over the place. One month you're way up and the next you're way down. Then you could be flat. There is in fact a seasonality or rhythm to the numbers, but that is way too much detail for this letter.
So, why does the BLS use the Birth/Death Assessment? They found out early this decade they were missing new businesses, so they created the B/D Assessment to try to get closer to the real number.
Nine months (more or less) after the BLS does it payroll employment number, we get the actual number from the state employment insurance reports. Since no one will pay unemployment insurance on employees they don't have, if you add up the number of employees in the program, you come pretty close to the actual number (again, with some adjustments).
That and other data allow the BLS to adjust the unemployment numbers to something on the order of pretty darn close. By adding in their B/D Assessment they have been able to reduce their revisions rather dramatically. The following chart shows what the revisions would have been without using the B/D model, and what they are by using it. Clearly the B/D numbers have been useful in damping down the volatility in the BLS employment data. Since they started using this number, the average revision has been less than 0.2%.

Stay with me. The BLS adds the non-seasonally adjusted B/D number to the non-seasonally adjusted survey numbers and then seasonally adjusts the total, so that the number we get each month have a more smoothed appearance.
And Miller is right about this. The imputations they must make for non-respondees is far larger than the B/D Assessment. And in months with large basic survey numbers the difference the B/D numbers makes is very small. In other months it can have more impact, but it does smooth out the overall number. I stand corrected.
When you think about it, the fact that the BLS can survey an economy with 130 million jobs that sees 3% of those jobs change each month, with tens of millions of new jobs being created and lost each year and hundreds of thousands of new businesses being created or dying, and then get within + or – 100,000 jobs with reasonable probability on their number, is pretty good.
A Breakdown in Communications
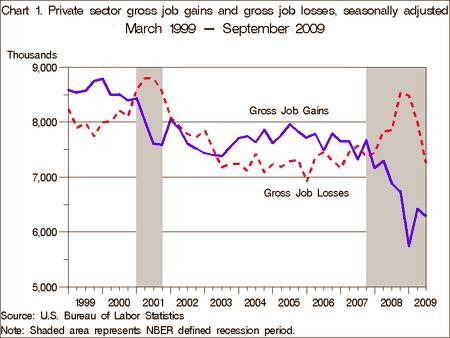
Miller tracks job creation and losses from yet another report, the BED report, which is based on state unemployment insurance data and is thus accurate, if nine months behind. Let's look at the chart he produces:

Note that even in the worst of the Great Recession, the US was creating almost 6 million jobs a quarter. It's just that we were losing over 8 million, so unemployment rose dramatically.
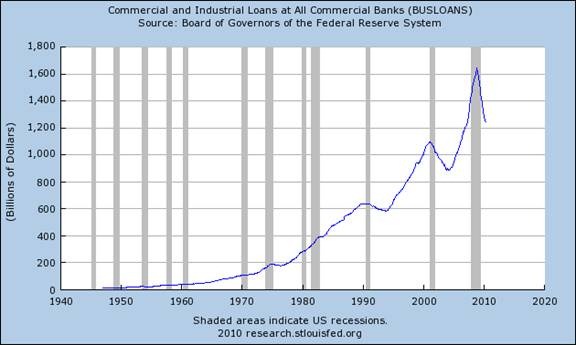
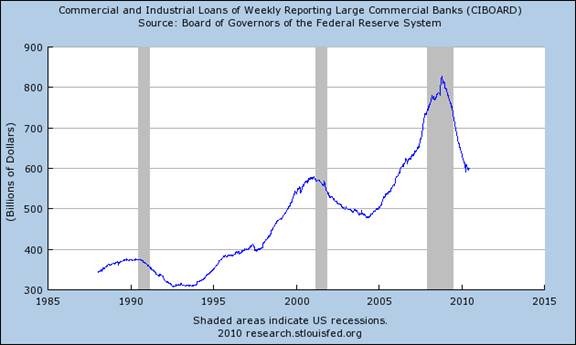
Second, Miller notes that job creation and loss more or less tracked with each other for the last ten years, until early 2009, when the relationship simply fell apart. In our discussion, he was curious about the reason for this. I told him I think the reason is in the next charts I am going to show you. (You can see his piece on the whole employment issue, with a lot more detail, at http://oldprof.typepad.com/a_dash_of_insight/2010/06/understanding-the-employment-issue.html.)
Notice the dramatic falloff in bank lending below. It occurred about the same time as the large differential in the job loss and gain numbers. Also notice that lending at large banks is down by over 25%, and there seems to be no sign of that improving. Leverage and loans allowed small and medium-sized businesses to expand. That blood supply has been cut off, and with it the job creation that comes from business expansion.


Mohamed El-Erian's thought is that employment is now a leading indicator in the sense that the Fed and other policy makers look at the employment numbers and adjust their policies going forward, influencing the economy of the future.
Some Thoughts on Double-Dip Recessions
Let me be clear about something. The US economy should not dip back into recession next year. I certainly think the data tells us it will slow down as the stimulus starts to go away, but a slow Muddle Through Economy is not a recession. Double-dip recessions are rare. The last one we had was in 1980-82, and then it was Volker with his foot on the inflation brake that caused it.
The reason I think that we could see a double-dip recession is the rather large tax increases (over 1% of GDP) that will come beginning in January 2011, coupled with large tax increases or spending cuts at the state and local levels (also 1% of GDP). We will get to see whether taxes matter.
Now, if Congress decides to delay those tax increases or stretch them out over a few years, or reduce them, that assessment could change. Right now, there seems to be little talk about doing that. Stay tuned.
John Mauldin is president of Millennium Wave Advisors, LLC, a registered investment advisor. Contact John at John@FrontlineThoughts.com.
Disclaimer
John Mauldin is president of Millennium Wave Advisors, LLC, a registered investment advisor. All material presented herein is believed to be reliable but we cannot attest to its accuracy. Investment recommendations may change and readers are urged to check with their investment counselors before making any investment decisions.
|
|