| Corcoran Technical Trading Patterns For July 12 |
| By Clive Corcoran |
Published
07/12/2010
|
Stocks
|
Unrated
|
|
|
|
Corcoran Technical Trading Patterns For July 12
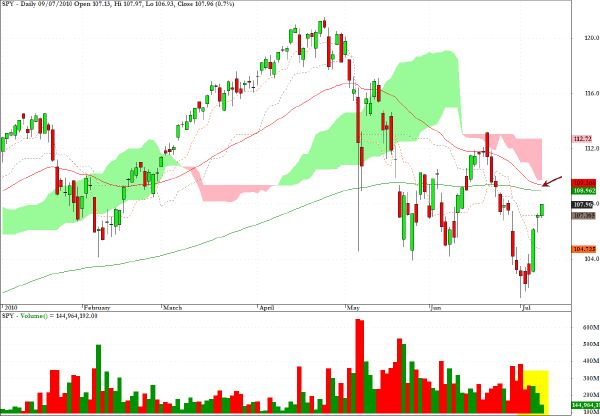
Even though the appetite for risk assets saw a bounce last week and equities made a nice recovery from their precarious position there is some concern about the lack of volume that is being seen in certain barometer sector funds which one would expect to see benefit from the Risk ON tone to the markets.
Over the course of last week SPY moved up by 5.6% - a large chunk of which came on Wednesday and the area indicated on the chart around 109 - equating to the 1090/3 area on the S&P 500 cash index - still seems like a feasible target during the course of this week.
However, trading in Europe and Asia on Monday has been quiet and uninspired and with earnings reports due later this week the suggestion would be to focus on short-term trading opportunities with a tendency to do the converse to the bi-polar moves which are likely to be seen based on "news". Sudden drops should be bought intraday and any moments of euphoria, especially in the region of 1093 on the S&P 500 cash index, are probably worth fading.
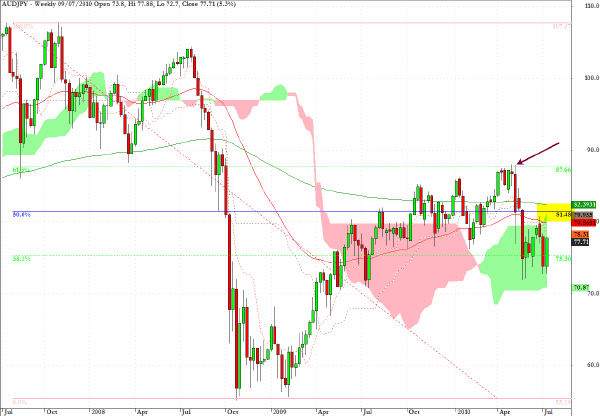
The chart below for AUD/JPY shows just how closely this key FX carry pair tracks many global equity indices.
As noted above, the SPY moved up 5.6% last week and AUD/JPY moved up 5.3%. Even stronger correlations can be found between AUD/JPY and EEM or BKF.
The chart for AUD/JPY includes the fibonacci grid covering the swing top at almost 108 in July 2007 and the bottom at approximately 55 in October 2008 and repeated in February 2009. (Interestingly the top is almost exactly twice the value at the trough).
There are two comments that I shall make on this chart for today.
1. The peak at 88 on May 4 exactly coincides with the 62% retracement of the entire drop from the peak to trough.
2. The 50% retracement lies at 81.48 and so far has eluded the pair since the flash crash and sharp drop in later May and again in early July. As can be seen there are a lot of technical barriers around the 80 area and I would suggest that the underlying risk dynamics for equities will become more critical again if the pair stalls at or around the 80 level as it did on June 21.
Many traders who focus on forex will tend to trade in the spot inter-bank market but others will want to trade the ETF’s which are available for foreign currencies and FX indices.
One of the areas that I am currently working on (and which will be presented at the workshop at London’s Canary Wharf in September, which is referenced at my website) looks at correlations between the key FX pairs and their co-movements with major ETF’s including the currency based ETF’s.
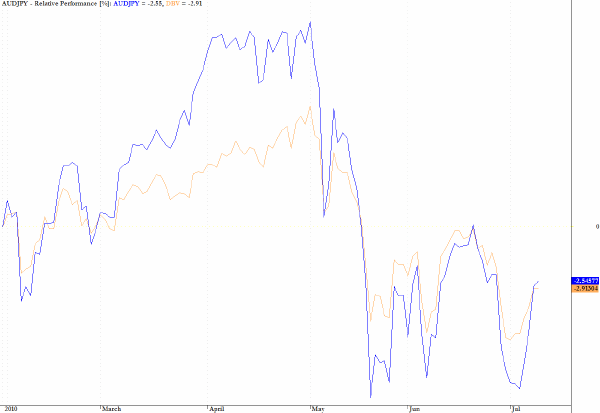
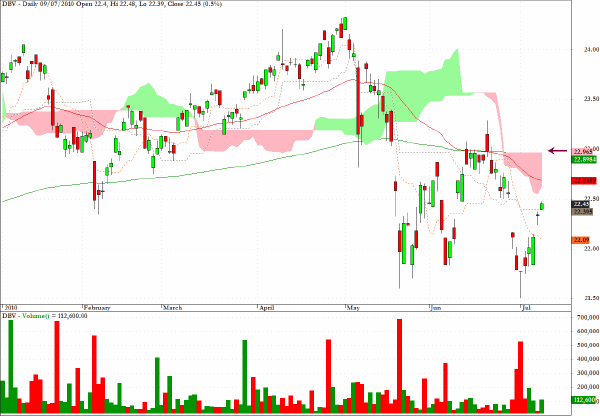
The chart below indicates the strongly correlated movement between AUD/JPY and the exchange traded fund, DBV, which in many ways allows traders to play the FX carry trade.
There is equally strong correlation for CAD/JPY and DBV and when risk appetites are on the increase and one does not take a long position in CAD/JPY or AUD/JPY, buying DBV is a useful alternative.
I discuss the outlook for DBV below but wanted to point to the correlation in this comment.
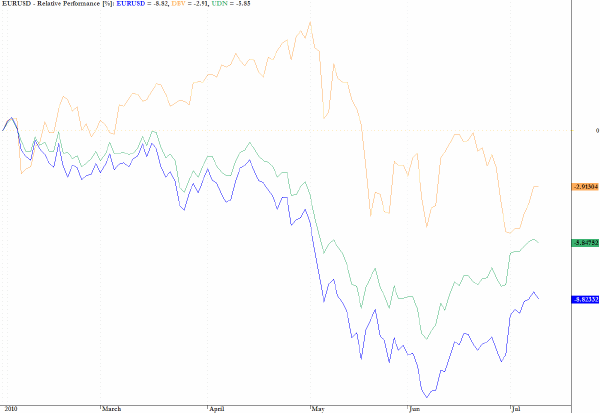
On a similar theme to the discussion above, the ETF which is often used as a surrogate for a short position on the US dollar index, UDN, is remarkably correlated to EUR/USD. This is worth remembering since the ETF will track the movements in the euro with a correlation coefficient exceeding 0.9 most of the time and does not really offer much other benefit if one has a view on, for example, USD/JPY.
DBV is an ETF which represents a basket of long futures positions in G10 currencies, with higher weighting for the higher yielding currencies, and is, as suggested above, a useful fund for traders wanting to emulate the performance of AUD/JPY and CAD/JPY or the FX carry trade in general.
As the chart suggests there is further scope for upside movement but I would suggest lightening up on positions as we move into the cloud and would exit any long positions at the flat top to the cloud around $23.
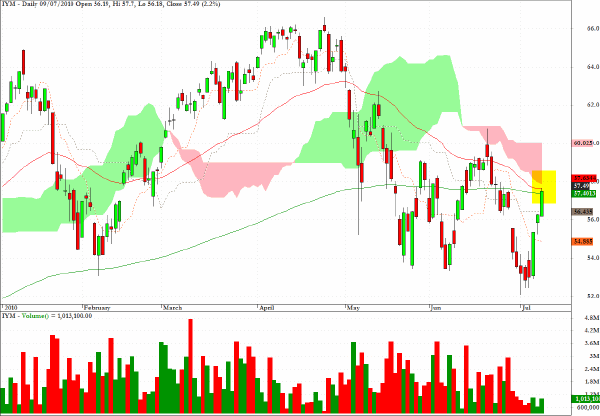
IYM is one of the sectors to be long when the risk on dynamics move to the fore. However, the chart below does suggest that, in the near term, the easy money may have already been made in this basic material sector last week.
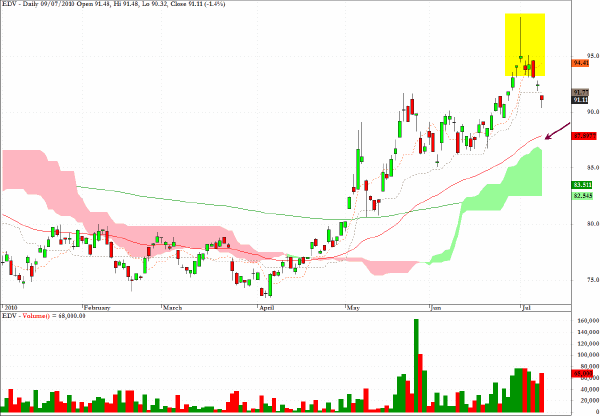
As suggested here last Tuesday, the exchange traded fund EDV, which represents a play on long term Treasury prices, was a good short opportunity and there could still be scope for further downside.
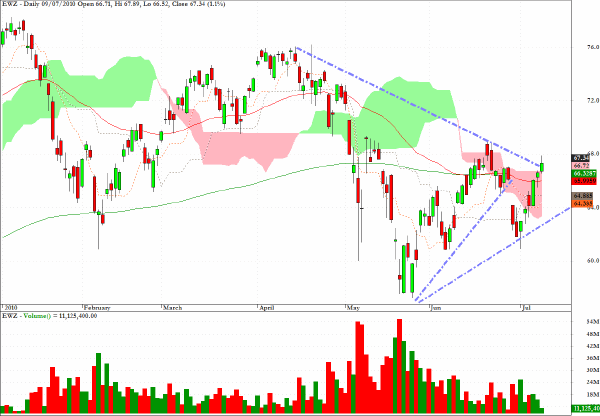
The chart for EWZ, which tracks the MSCI Brazil Index, reveals an interesting reversal pattern where the initial break out from the triangular pattern was to the downside, but where there is now the clear possibility that a move above the descending trendline could change the complexion for this key market.
As noted above the more supportive environment for risk assets is working in favor of the emerging markets but there are still hurdles to be crossed - including a pick up in what has been anemic volume - before one can say that the tide has turned.
I shall be checking this chart carefully this week for clues as the vitality of the animal spirits.
Clive Corcoran is the publisher of TradeWithForm.com, which provides daily analysis and commentary on the US stock market.
|