| Corcoran Technical Trading Patterns For July 13 |
| By Clive Corcoran |
Published
07/13/2010
|
Stocks
|
Unrated
|
|
|
|
Corcoran Technical Trading Patterns For July 13
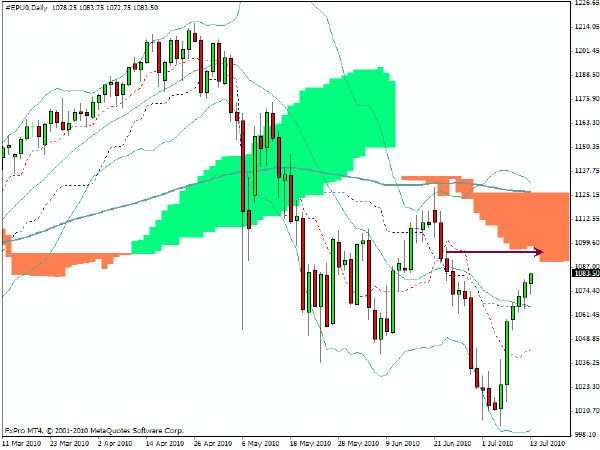
The S&P 500 futures have been enjoying some sudden surges during morning trading in Europe, perhaps as a belated response to the release of Alcoa’s better than expected earnings, more likely for entirely technical reasons, and are headed, in my estimation, for a test of the 1090/5 area today.
The overall tone of the market remains one of low volume with some erratic movements in key currencies such as the Australian dollar, as discussed below, and I would not be looking to augment my slightly net long exposure at present in risk asset sectors.
The lack of volume on upward movements in equities is still a cause for concern but there are indications that those who are pulling the trigger on the short side are being easily spooked and this is providing the catalyst for further upward progress.
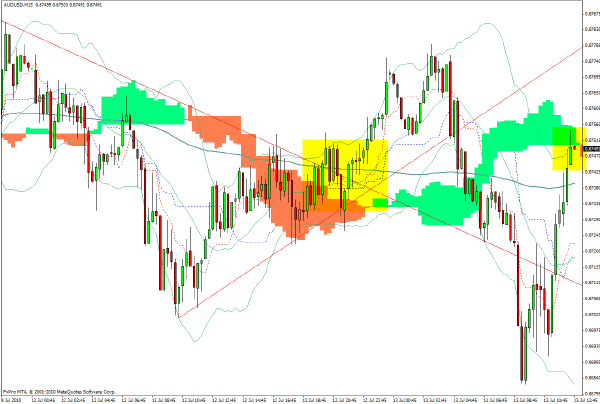
The 15-minute chart for AUD/USD shows some fairly wild trading during the last 24 hours. The apex of the triangle which is highlighted in the middle of the chart lead to a breakaway move, initially to the upside which was then dramatically reversed in Asian trading, and in the last few hours has reversed yet again.
I will be looking at building short positions between 8750 and 8800 but would be prepared to exit completely if the pair takes out the previous daily high of 8857 registered on June 21.
Assuming 8860 is not hit, scaling out of the position with a longer-term downside target of 8470 will be the plan of attack.
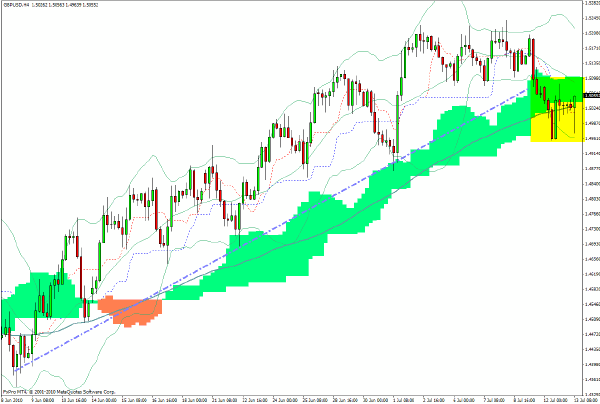
GBP/USD looks to be skating on thin ice at present and if there is a decisive move below the green cloud there could be a cascade down towards $1.4875
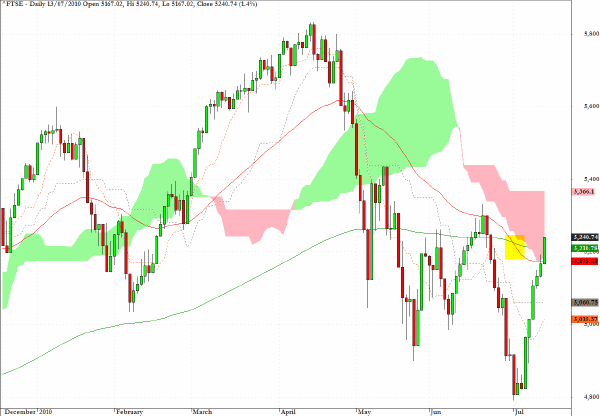
The FTSE 100 has benefited from the Alcoa news as it is an index with heavy exposure to the mining and materials sector. The flat top to the cloud at 5366 suggest that this will be an area of strong resistance.
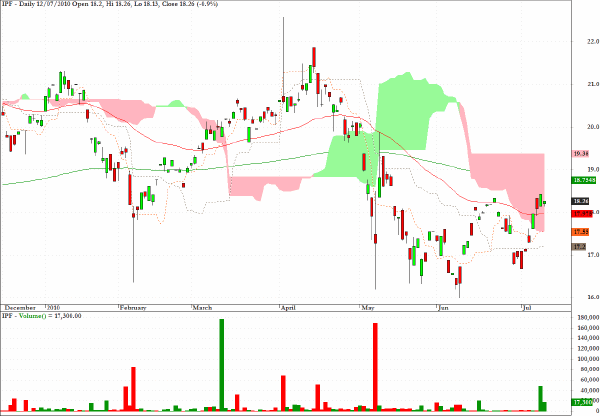
I shall maintain a long position in IPF, which is an exchange traded fund which tracks the international financial sector, while the risk appetites remain in ascendancy. But the flat top to the cloud formation suggests that this will be a major obstacle in the intermediate term.
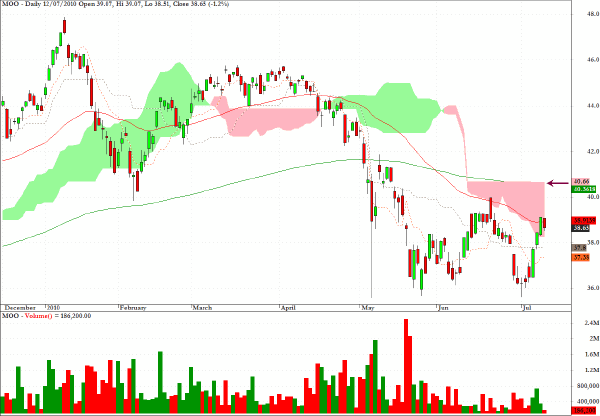
MOO is another sector fund which correlates highly with increasing risk appetite dynamics and I would anticipate further progress towards the level indicated by the arrow on the chart.
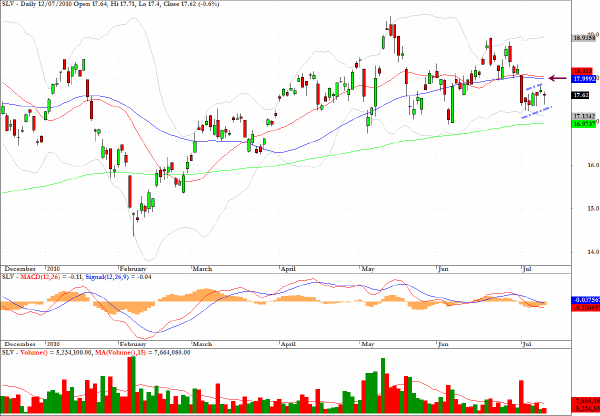
The daily chart for SLV, the exchange traded fund for silver, shows a bear flag formation and overhead resistance at the intersection of the 20 and 50-day EMA’s.
Clive Corcoran is the publisher of TradeWithForm.com, which provides daily analysis and commentary on the US stock market.
|