| Corcoran Technical Trading Patterns For July 16 |
| By Clive Corcoran |
Published
07/16/2010
|
Stocks
|
Unrated
|
|
|
|
Corcoran Technical Trading Patterns For July 16
Thursday’s action in US equities reinforced my decision, expressed here yesterday, to sit on the sidelines as the intraday whipsaw behavior observed reflects the strong cross currents - both technical and fundamental - that are currently creating turbulent conditions for the S&P 500. I would expect another test of 1100 in coming sessions, the outcome of which may alleviate my unease about taking a firm view, but equally a break below yesterday’s low on the S&P 500 futures at 1076.25 would be bearish.
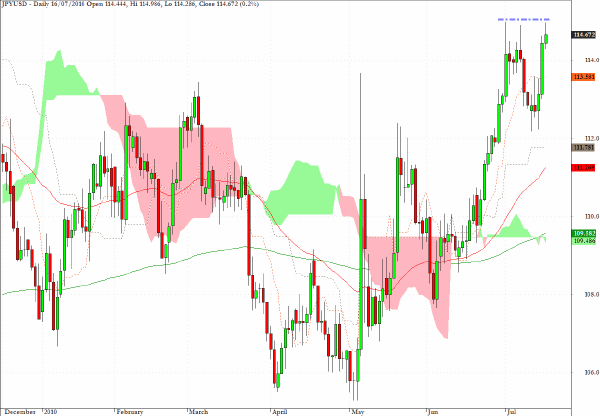
My focus again today will be on the Japanese yen. The chart below is somewhat unorthodox in that it shows the JPY/USD rate - which is the inverse of the more common version USD/JPY. The possibility of triple top pattern is still undecided as this is being written and again the outcome will be useful for detecting the way that macro funds using FX/ETF correlations strategies are currently leaning.

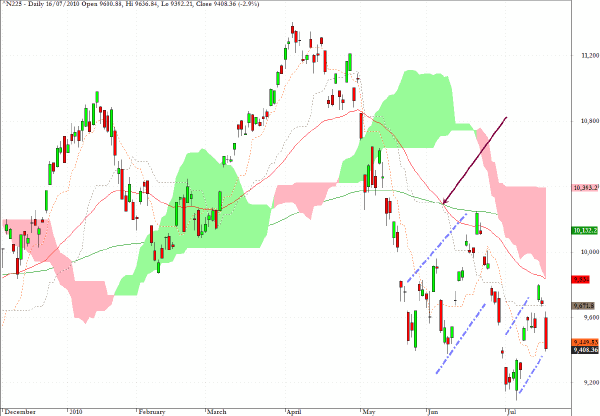
Traders in the Nikkei 225 in Asian trading overnight were clearly not enamoured with the chart above and the continued yen strength, and the index sold off hard with an almost 3% decline.
An evolving downward staircase pattern could be emerging, and as global investors seem to be avoiding the US dollar at present, if the safe haven appeal of the yen was to continue in earnest, then the 9200 level could be taken out and this would be a notable negative for this market. The arrow indicates the "death cross" on this chart and the recent action has served to underline that, among global equity markets, the Nikkei 225 is often at the bleeding edge of asset re-allocation shifts.

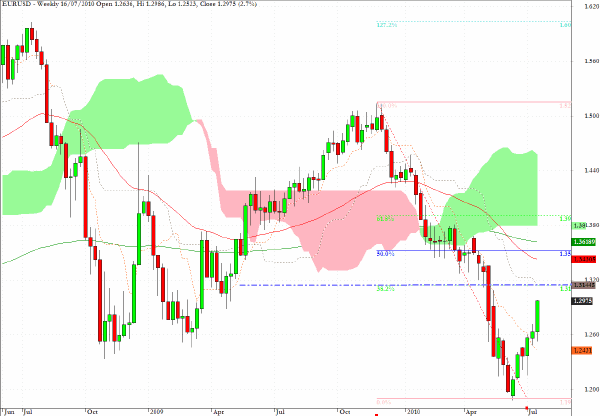
EUR/USD is testing the $1.30 level as this is being written and the remarkable shift in sentiment towards the EZ currency highlights the bipolar nature of investor sentiment which currently prevails. In yesterday’s session there was considerable profit to be made from a long EUR/USD position and an adjustable short EUR/JPY position depending on the expected direction of USD/JPY - which yesterday was fairly easy to predict, i.e. it was to sell any rallies.
The fibonacci 38% retracement grid shown on the chart indicates that the $1.3145 area could be an intermediate-term target but for today I would not be surprised to see sellers emerge at the $1.30 barrier.

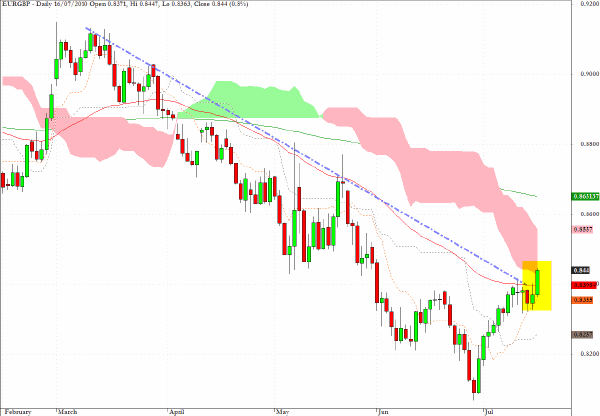
EUR/GBP is at a fairly critical level and I shall be watching this cross rate closely today. Despite the technical violation of the downward trendline, my intuition is that the euro will falter against sterling near current levels, but I would rather see just how much short covering still needs to be done on EUR/USD before taking a stance.

Clive Corcoran is the publisher of TradeWithForm.com, which provides daily analysis and commentary on the US stock market.
|