| Corcoran Technical Trading Patterns For July 19 |
| By Clive Corcoran |
Published
07/19/2010
|
Stocks
|
Unrated
|
|
|
|
Corcoran Technical Trading Patterns For July 19
Last week I used some inverted forex charts to throw a slightly different perspective on the behavior of key pairs to those that are normally used. For example, USD/JPY is the customary way that the dollar/yen is quoted with the US currency as the base currency and the yen as the quote or terms currency. As USD/JPY drops so the dollar is weakening against the yen.
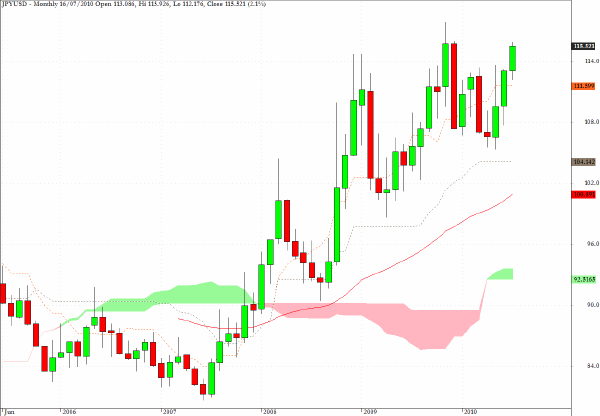
If, however, the chart is inverted and the pair is expressed as JPY/USD, with the yen as the base currency, the strength of the Japanese currency over the last three years becomes especially apparent.
The monthly chart below reveals how the yen has become a safe haven play since the beginnings of the great unwinding of leverage which began in mid 2007. The retreats in the yen reveal the periods when risk on dynamics have prevailed and the renewed strength in the yen coincide with risk off period.
As can be seen, the currency appears to be discounting a new period of risk aversion ahead.
The interesting issue, to put it simply, is when does the safe haven play with the yen coincide with the safe haven play into the US dollar?
When such coincidental movements arise it could be claimed that, in effect, this is the canary in the coal mine suggesting that it is time to fasten one’s safety belts. The theme of today’s newsletter is that there are some signs that such a coincidence may lie ahead in the coming weeks.
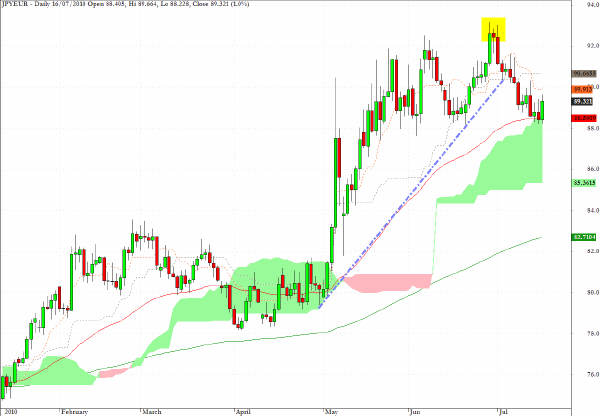
The daily JPY/EUR chart below shows the damage to the euro during May and June before the trendline was broken, and the yen could now be finding support at the top of the cloud.
Does this mean that the yen will continue to appreciate against the dollar? Not necessarily, but it could suggest that the euro may be coming close to the end of its rally against the dollar and even if yen/dollar remains relatively stable, a renewed slide in the euro would see the yen move back towards a retest of the high on the chart below.
One other scenario worth contemplating is that the yen could be topping out against both the dollar and the euro and that would really unsettle the FX/ETF correlations which inspire so much algorithmically inspired asset allocation decisions of many macro funds. If that happens, not only would safety belts be appropriate but crash helmets could be advisable as well.
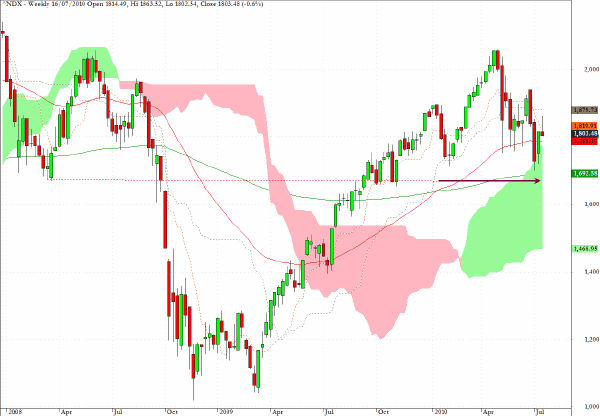
The weekly chart for the Nasdaq 100 (NDX) shows that a key trendline has been violated (not illustrated) and that the level indicated by the arrow around 1650 is fairly critical for this index and I would expect it to be tested in coming weeks.
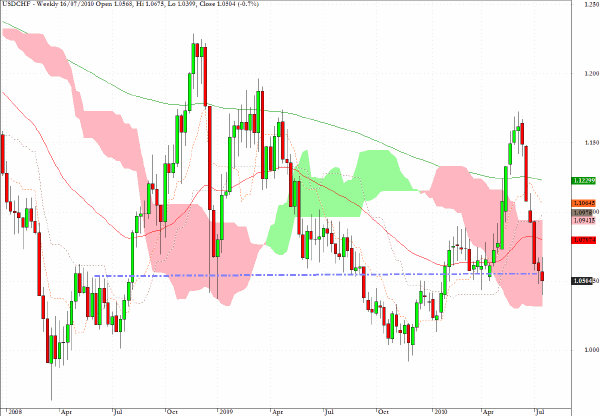
Referring back to the matter raised in comments on today’s first chart, there are early signs that the recent and abrupt retreat of the US dollar may be overdone and ready to take a pause. The weekly chart for USD/CHF looks to me as though the risk/reward ratio is now shifting towards one of buying the USD on weakness against the Swiss franc rather than selling it on strength.
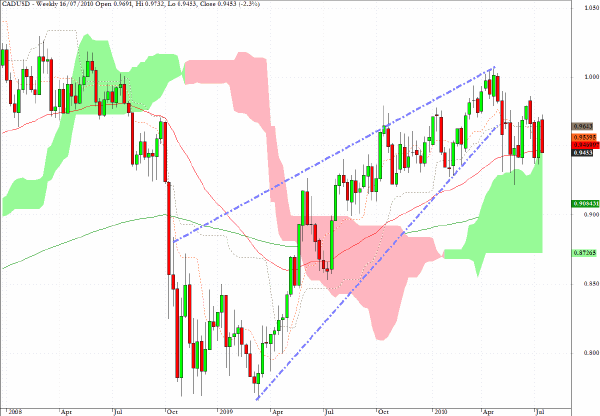
The chart below is another example of using an inverse version to the more customary chart and shows the Canadian dollar as the base currency against the US dollar.
Once again it is not too difficult to see that the major move up in the Canadian currency may have been seen and while there could be a complex topping pattern in progress - which could take some time to evolve - there is a likelihood that a longer-term trend reversal may be in the pipeline.
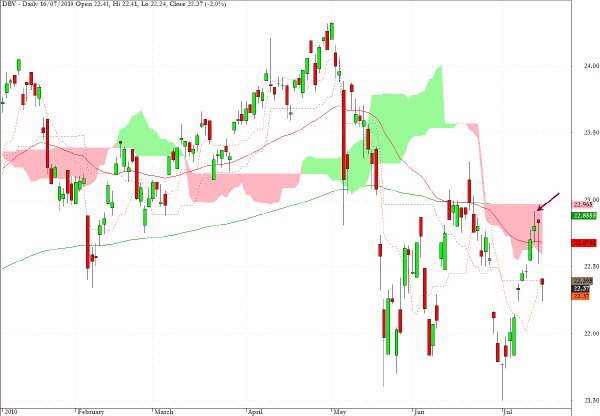
A week ago I commented that my earlier recommendation to go long DBV had reached my target near $23 and that I was now flat. With a little more conviction I should have reversed and gone short!
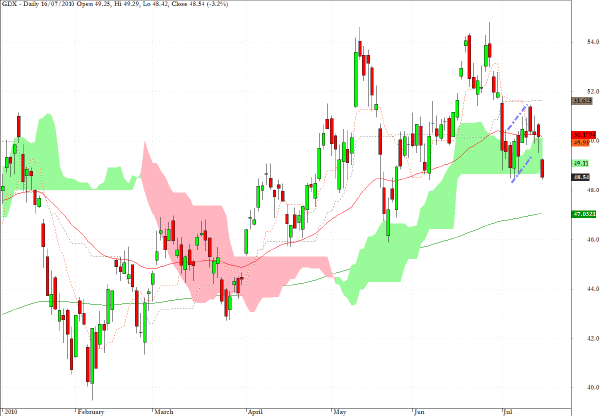
In line with several comments here over the last couple of weeks the intermediate outlook for the precious metals and the mining stocks remains bearish. GDX shows a text book version of the bear flag formation and AU discussed here last week has, unsurprisingly, a similar appearance.
However, I would hesitate to overstay one’s welcome on the short side with AU as it may find support at the 200-day EMA near $40.
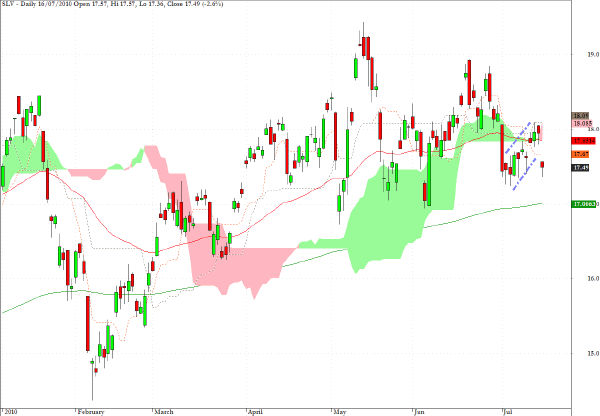
Here are my comments from the July 15 newsletter.
SLV is still tempting me on the short side - the bear flag has caught my attention but I have refrained from taking a position so far. Any move up towards the descending trend-line would allow me the excuse to pull the trigger.
Here are my comments from July 12’s Daily Form.
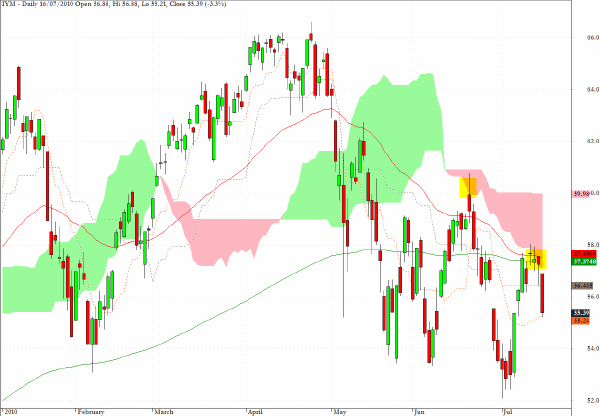
IYM is one of the sectors to be long when the risk on dynamics move to the fore. However, the chart below does suggest that, in the near term, the easy money may have already been made in this basic material sector last week.
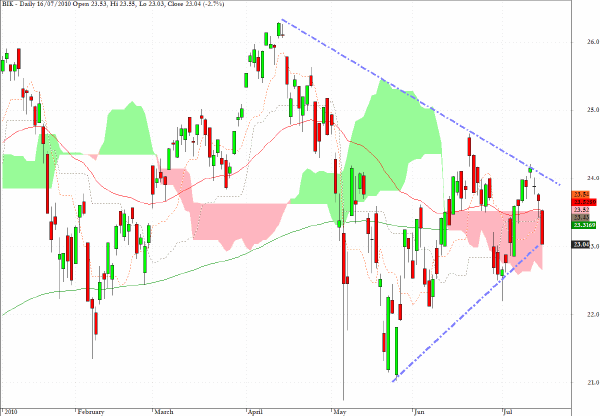
BIK - a play on the BRIC economies - is at the apex of a triangular formation and, in line with other recent resolutions of similar patterns, one might expect a false breakaway pattern initially only to be eventually followed by the next major directional move. If I was betting on the way that this will play out (I don’t intend to take a position for the time being) my suspicion is that we go up before we go down.
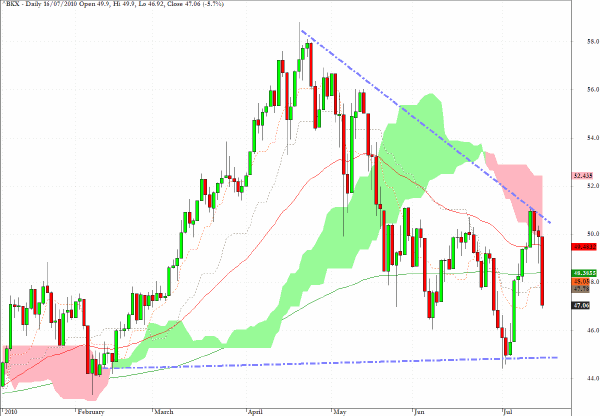
The KBW Banking index has been unable to break above the descending trendline illustrated and the price progression seems likely to reach down to the base of the triangle before the more critical issue of longer term directional bias has to be resolved.
Clive Corcoran is the publisher of TradeWithForm.com, which provides daily analysis and commentary on the US stock market.
|