| Corcoran Technical Trading Patterns For July 22 |
| By Clive Corcoran |
Published
07/22/2010
|
Stocks
|
Unrated
|
|
|
|
Corcoran Technical Trading Patterns For July 22
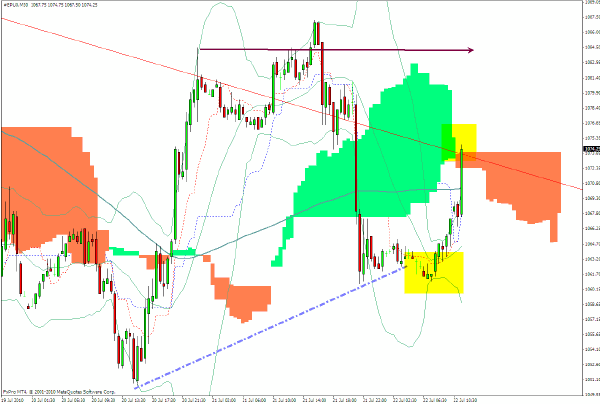
S&P 500 futures have moved up abruptly during early European trading this morning and broken above the 30-minute cloud top displayed on the chart below.
The other area highlighted on the chart shows a fake breakdown from the upward trend-line following the range constriction which developed in Asian trading overnight.
For now the key test for the bulls today will be to re-challenge yesterday’s high. This would alleviate the concern that the activity above the descending red line on the chart (which dates back to the last major triangle breakdown) was itself a false breakout.
In general, because equity and FX markets are fairly critically poised at present, I would be wary of taking "breakaway" patterns too seriously until they are validated with major moves accompanied by much heavier volume than is currently being seen.
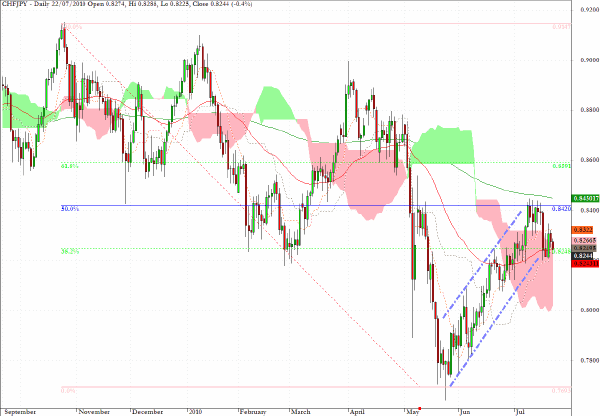
The daily chart for CHF/JPY, which includes Thursday’s action until the time of writing, reveals the reversal behavior seen in Tuesday’s session and underlines my concern that for this key FX pair, which can act as an alert to major shifts in risk appetite and sentiment, we are now at an important juncture.
In intraday trading a weakening yen is seeing CHF/JPY move above 83.30 which is a positive for risk on, and if we see a close today above 83.85 that would reinforce my view that the S&P 500 will be heading back towards the 1095 level in the near future.
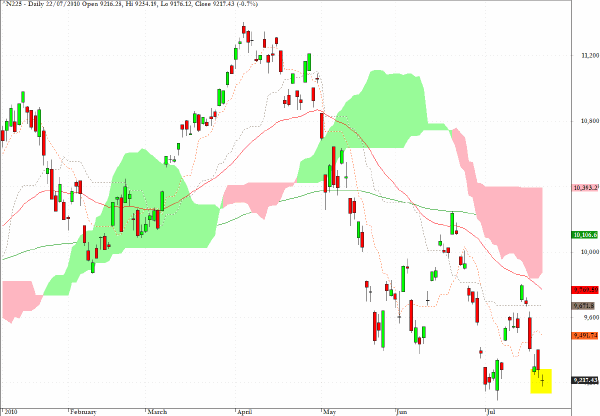
The Nikkei 225 has closed Thursday’s session with a drop back towards recent lows around 9200. The tiny doji star could be the precursor to a morning star candlestick following tomorrow’s session - which would be a sign that a tradable base is in place - but this will not be resolved until the US trading session is completed today, and an even more important clue will be provided if there is greater clarity regarding the short-term direction of the yen.
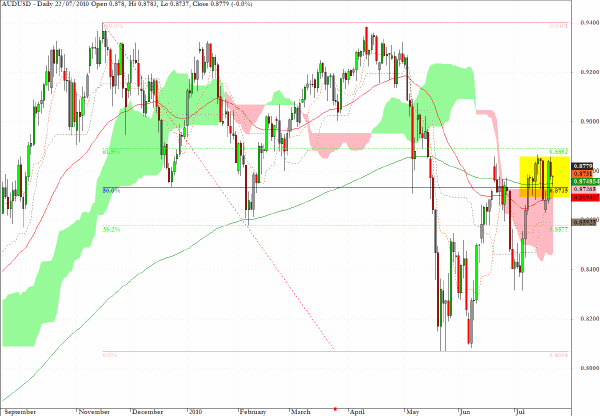
The Australian dollar AUD/USD lies at an interesting conjunction of several key technical levels and essentially at the midway point between the November high and the May/June low. I would suggest that the pink cloud top should provide short-term support but also that the 0.8900 level (the 68% retracement from the low) will also be a barrier.
There is a range-trading opportunity for short-term FX traders who are nimble, but a decisive break out of the channel between 0.87 and 0.89 will provide important clues as to the longer-term appetite for risk among macro asset allocators.
Here again is my comment from Monday’s newsletter.
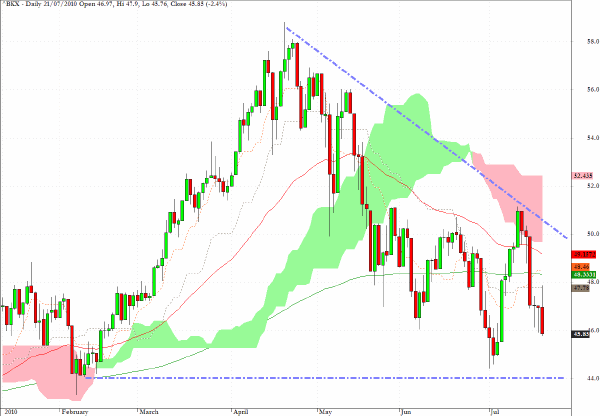
The KBW Banking index has been unable to break above the descending trendline illustrated and the price progression seems likely to reach down to the base of the triangle before the more critical issue of longer-term directional bias has to be resolved.
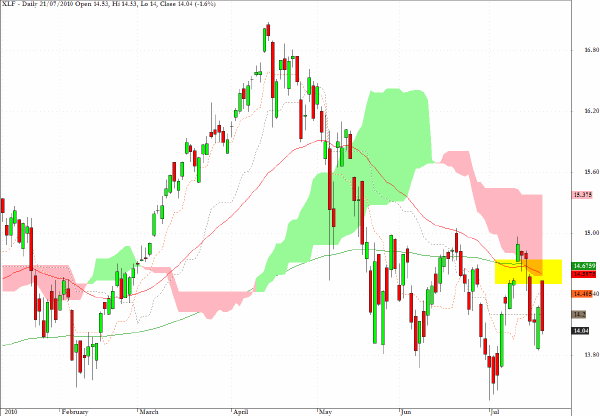
The daily chart of XLF, the exchange traded fund for the financial services sector, shows the abrupt reversal from yesterday’s session and a failure at the base of the cloud and the intersection of the 50 and 200=day EMA’s. As already suggested so many sectors are at unusually critical technical levels and XLF is no exception.
A break below $13.30, just below Tuesday’s low, would suggest that the financial sector could be in danger of taking out its low from last February.
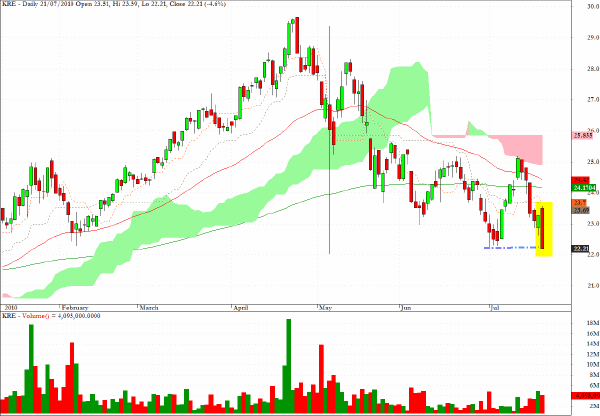
Perhaps a foretaste for what lies ahead for the banking sector and XLF as just discussed, can be seen in the daily chart for KRE, a sector fund which acts as a proxy for the regional banking sector. Yesterday KRE broke to a new multi-period closing low and almost touched the level seen in the May 6 "flash crash".
I am reminded of all of the skeptics who claimed that the May 6 low was an aberration and of all the misguided chatter about "fat finger" traders etc. It turns out that the intraday prints on the ETF charts from May 6 have been extraordinarily prescient in anticipating where certain sectors were headed.
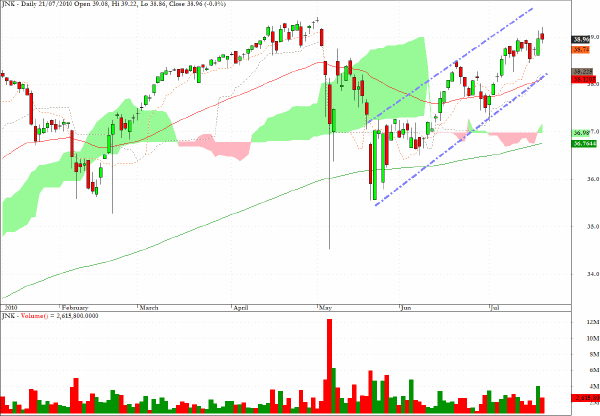
Without too much stretch of the imagination it is possible to diagnose the chart action since May 6 in JNK, a surrogate for the high-yield bond sector, as one extended bear flag pattern.
Even if such an interpretation is not valid I am persuaded that the risk/reward profile for this sector does not favor the bulls.
Clive Corcoran is the publisher of TradeWithForm.com, which provides daily analysis and commentary on the US stock market.
|