| Corcoran Technical Trading Patterns For July 23 |
| By Clive Corcoran |
Published
07/23/2010
|
Stocks
|
Unrated
|
|
|
|
Corcoran Technical Trading Patterns For July 23
The futures for the S&P 500 (mini) are moving higher in European trading on Friday morning and are approaching the test of the 1095 level, probably on their way to 1100 which could be seen in early trading when New York opens.
In yesterday’s commentary I suggested that the FX movements which I monitor closely were becoming more aligned as positive for risk on strategies and the upbeat tone to sterling (following much better Q2 GDP figures than expected) and the euro (EUR/USD and EUR/JPY) (which also had positive news from Germany’s IFO data) should allow the bulls to seriously take on a challenge of the 1100 level.
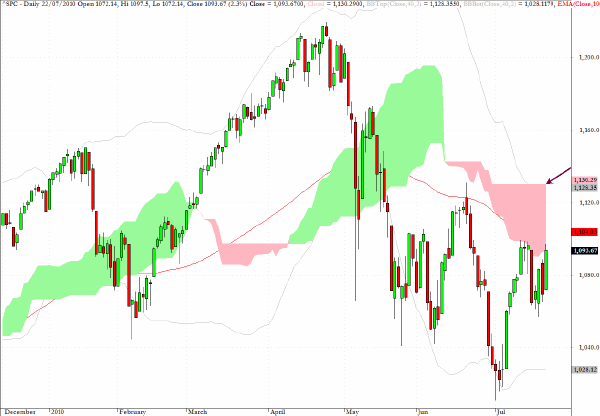
The key question which I intend to address in a TA slot on CNBC’s European Closing Bell this afternoon will be whether the S&P 500 can move back to, and then possibly beyond, the 1130 level. Readers may wish to review the last chart in today’s letter which will be one of those that CNBC will be rendering during the segment which takes place at about 16:40 London time.
The broadcast slot will be just ahead of the release of the stress tests for European banks which could be a market moving event, although I am perhaps cynical enough to believe that if there were dramatic bad news to be released it would have been leaked already. Besides, the stress tests were not conducted independently and the banks, according to reports this morning, were not asked to model the scenario of any EZ sovereign defaults. So just how much confidence one can have in the results I'll leave to the reader’s discretion.
All I would say is that August has shown itself to have a nasty track record for throwing up major financial surprises and the fiscal situation in a number of Club O’Med (notice the addition of the "O" to cover Ireland) is almost certainly no less worrisome than it was a few febrile weeks ago.
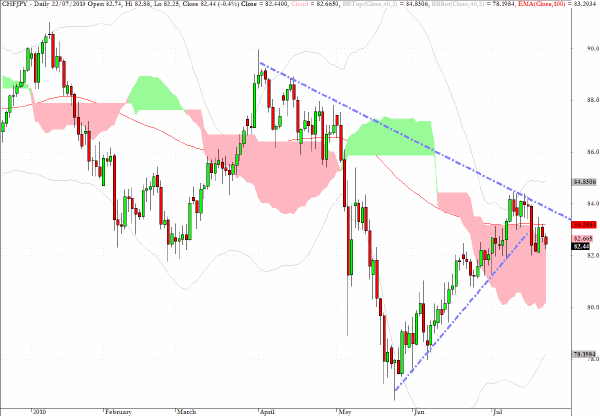
Part of the answer to whether the S&P 500 will reach back to the 1130 level will become clearer in the price development of the CHF/JPY pair which I discussed here yesterday.
As discussed yesterday, a break above 83.85 would validate a more robust risk on posturing and we came quite close to that level yesterday. Within the last 24 hours 83.77 is the highest point reached and once again I would suggest that 83.85 will become a test case for inter-market strategists as they try to take the S&P 500 up to 1100. Incidentally, I was right about my call yesterday that the 83.85 level would need to be taken out for the S&P 500 to close above 1095 - and even today, while I remain pretty confident that we are headed to 1100 near-term I'll be watching the Swiss/Yen for inter-market validation.
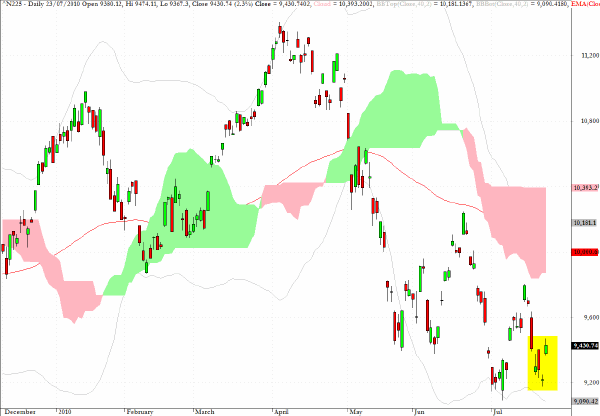
The Nikkei 225 moved up 2.3% in Friday’s trading, and while it did not produce exactly a morning star as anticipated here yesterday it has registered Thursday’s doji star as an "island" candlestick as expected.
Reviewing the action in the Nikkei over the last two months, there are an extraordinarily large number of overnight gaps revealed on the chart. The way I would interpret this is that it suggests a market which lacks any clear conviction and is highly responsive to the action on Wall Street the day before and to the movements in the yen. For a global asset allocato, the prospect of committing capital to a major equity market which seems so convictionless is not an inviting prospect.
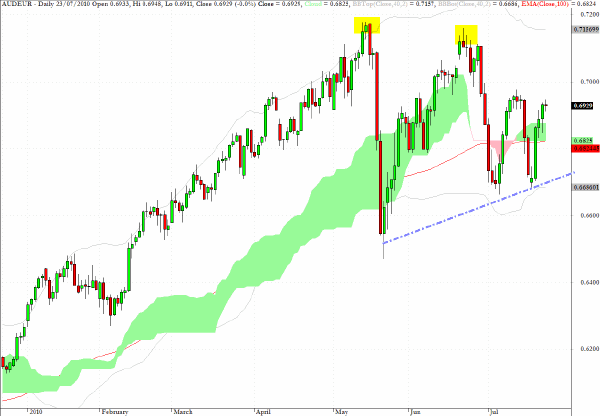
One of the charts which I'll discuss on CNBC Europe this afternoon is the inverse form of the more commonly quoted pair EUR/AUD which has been flipped to show AUD/EUR.
The general point that I'll be making is that the FX correlation dynamics are transforming away from strength in the commodity currencies leading the way to increasing risk appetites back towards a more "conventional" perspective that confidence in the euro portends a more adventurous approach to asset allocation than simply hiding out in US Treasuries.
Notwithstanding this transition in FX/ETF correlation dynamics, I would suggest that while the euro probably has further to go - probably to $1.3150 in the next week or so against the dollar - all of the EZ structural problems have not gone away. They are simply being less focused on as European policymakers prepare to head off to their various haunts for a nice quiet August!
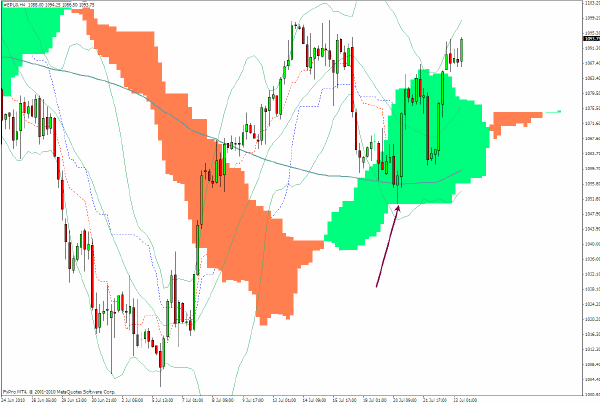
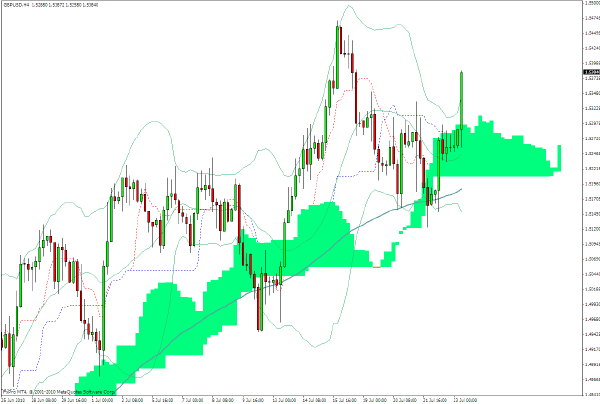
GBP/USD is surging back towards the previous high seen on the 240 minute chart below which is at $1.5475. Surprisingly good GDP numbers, released this morning, are propelling sterling back to a test of the $1.55 level and if that should be penetrated (of which I am doubtful) the next target for the upside would be the 100 period SMA on the weekly chart at 1.5665 and beyond that the cloud top on the weekly chart in the region of $1.60.
If we see a 1.6 handle on sterling this summer then clearly the hedge funds loading up on emerging markets and other risk on sectors will have plenty to celebrate.
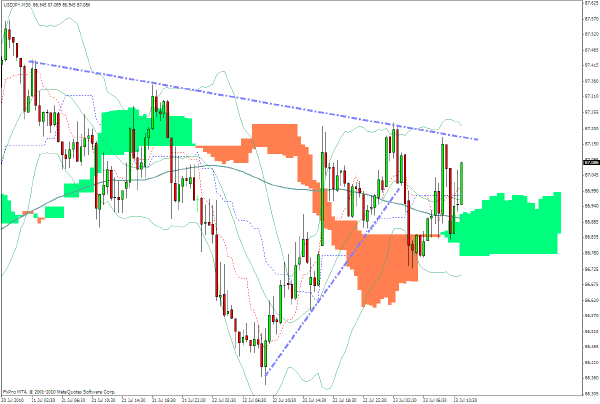
The 30-minute chart for USD/JPY was captured around 9.30 on Friday morning in European trading.
At present the pair is still in a downward-looking channel but, as intimated earlier this week, if the longer-term interpretation which I gave on Monday that future gains for the yen may not be easy to come by, then a reversal out of this bearish pattern (from the dollar’s perspective) would manifest itself by a weekly close today above 87.50.
The S&P 500 cash index needs to break into the cloud formation which lies just above yesterday’s close around the 1095 level and will then likely trade in a fairly erratic manner while it remains within the cloud. The clear upside target is the very flat top to the cloud at exactly the 1130 level.
As long as there are no major surprises from the Eurozone in the coming weeks I would suggest that 1130 is a feasible target. In my estimation, the risks of a sharp correction during the ascent through the cloud or at the attainment of 1130 will increase in proportion to the speed with which the move takes place, and especially if there is not a corresponding relaxation in the anxiety which is keeping ten-year US Treasury yields below 3%.
Clive Corcoran is the publisher of TradeWithForm.com, which provides daily analysis and commentary on the US stock market.
|