| Corcoran Technical Trading Patterns For July 26 |
| By Clive Corcoran |
Published
07/26/2010
|
Stocks
|
Unrated
|
|
|
|
Corcoran Technical Trading Patterns For July 26
The price action in a number of sectors suggests that equities are looking to move ahead but there are two main concerns that I have with this scenario.
1. Volume is lethargic and, even considering the time of year, one would expect to see more conviction from real investors rather than the algorithmic variety to sustain a move back towards the chart levels which are acting as temptation for the bulls.
2. The FX backdrop is not as supportive for a new risk on phase, at least at present, as one would hope to see (but see my comments below regarding USD/JPY).
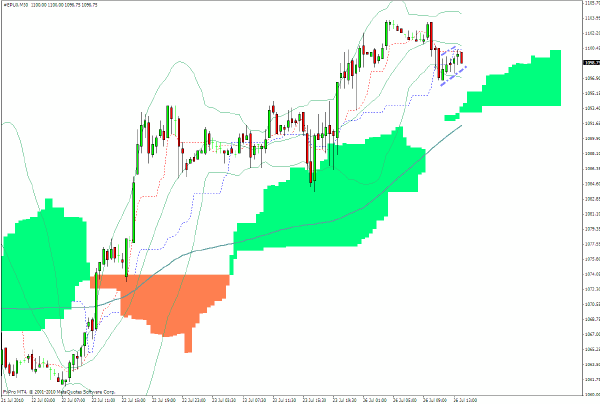
Meanwhile the S&P 500 futures in Europe are sliding slowly and, as the chart suggests, there is a bearish flag formation developing. There seems to be a growing belief that equities are ready for a summer rally and while this may transpire there are bound to be plenty of scenic diversions along the way.

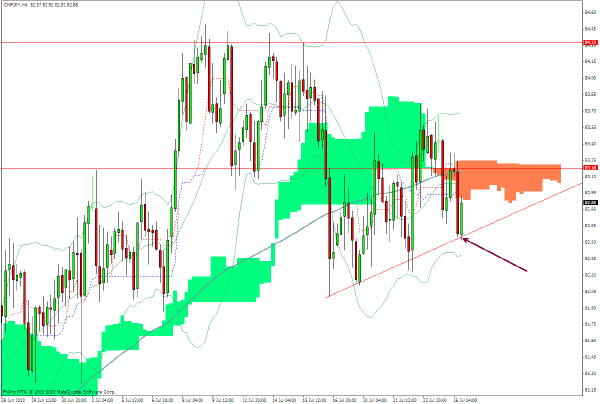
I bought CHF/JPY close to the level indicated by the arrow in early trading in Europe this morning, have taken a small profit and will be looking to exit the rest of the position at 83.20.
As suggested in Friday’s column, this pair needs to close above 83.85 to give a clear buy signal on equities, in my estimation.

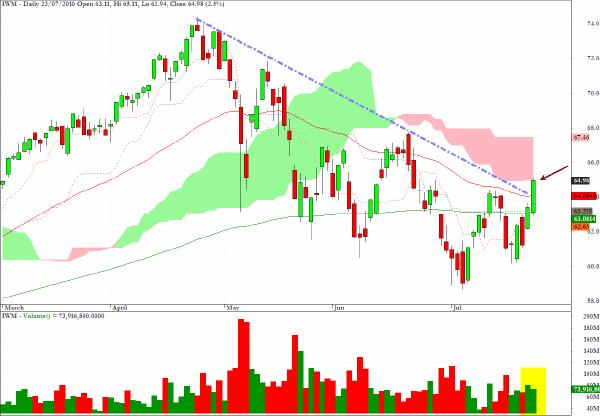
The exchange traded proxy for the Russell 2000, IWM, made a nice move up on Friday from a price perspective and peeked above the descending trend-line, but as highlighted the volume was relatively modest.
If the S&P 500 is headed to 1130, which seems like the likely target, one would expect the higher-beta Russell 2000 to be headed to 680.

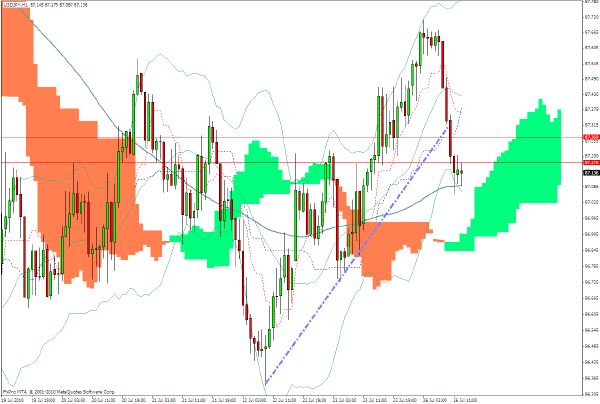
As is often the case, the Japanese yen is taking its own course in trading this morning in Europe. The current level is just above 87, and the drop since trading moved from Asia to Europe in the last few hours is not what one would expect to see to support a full-blown risk on initiative by large macro funds. Having said that, if we get a sudden reversal during the North American session, this would be a good signal that the tacticians had boosted the yen in an FX market with relatively low liquidity, in order to lay in the foundations for the normal inter-market correlation of risk assets up as yen goes down.

Clive Corcoran is the publisher of TradeWithForm.com, which provides daily analysis and commentary on the US stock market.
|