| Corcoran Technical Trading Patterns For July 28 |
| By Clive Corcoran |
Published
07/28/2010
|
Stocks
|
Unrated
|
|
|
|
Corcoran Technical Trading Patterns For July 28
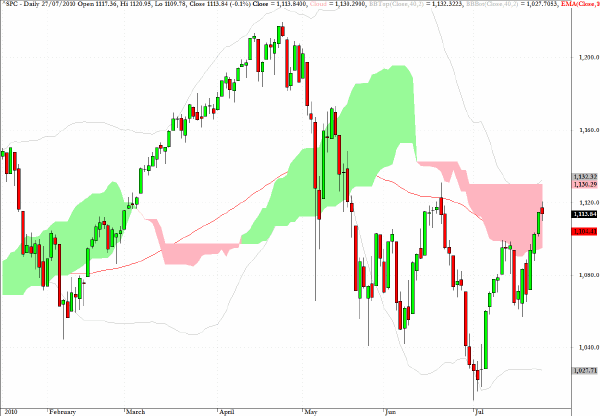
The volumeless rally in equities continues and for the S&P 500, despite some whipsaw behavior in yesterday’s session, the expectation is that the 1130 target could now be seen in the next few sessions, possibly even today.
Plenty of cheerful commentators are to be found, and the Eurozone woes, which were hanging over the market just a few weeks ago, seem to have been relegated to the bottom of the pile of things to worry about, along with evidence of anemic growth in the "mature" economies, weak consumer sentiment and evidence that local and governments throughout the US are facing major budgetary crunches.
Just for perspective it is worth recognizing that current world GDP is about $60 trillion and about half of that total is accounted for by the US and EU states. The often-cited powerhouse economies such as India and China together make up less than 10% of the total, although their rates of growth are far in excess of anything seen in western Europe and North America. Weighed against the bullish case for the BRIC economies, much of the rest of the world continues to de-leverage and as the consumers of last resort in the US, UK and other states which previously never saw a new product which they didn’t immediately want to own, have either exhausted all of their available collateral for credit or are too cautious to carry on with their previous profligacy.
Anyway, back to the charts and purely from a technical perspective one would expect there to be strong resistance at the 1130 zone, although a nice false break above it could lure some cash off the sidelines.
Should we see a decisive break through the obvious flat cloud top (which serves to underline the strength of the resistance) on the chart, then the absence of any further cloud above suggests that the bulls could really run with the ball during August. However, as mentioned here last week, one should remember that the month of the year when many investors are more concerned about reaching for the suntan lotion than monitoring their portfolios, has had a track record of creating nasty surprises.

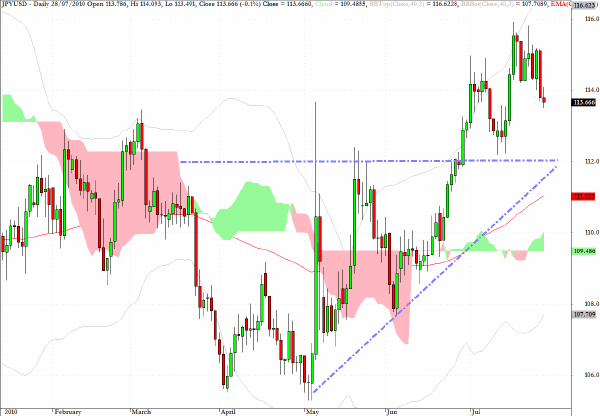
The Japanese yen could fall to the 112 level in this inverted chart of the more customary dollar/yen pairing before the uptrend would have been technically violated.
That would equate to 89.20 on the usual quotation method and I would suspect that level to be tested in coming sessions.
As part of my recent work for a book that I am writing and for workshops which I shall be presenting on inter-market analysis such as the following in London in September, I am becoming more focused on the theme of forex basis rotation in which certain key currencies such as the yen, euro, dollar and Swiss franc seem to maneuver themselves in relation to other movements in the capital markets. One of the keys to trading FX, which continues to present the most interesting challenges, is to align one’s position in other asset classes in accordance with which currency base is in the ascendancy at the time.
As conjectured the recent era of the Japanese yen prevailing, with the euro as a basis trailing, is now in transition, but my suspicion is that a US dollar centric perspective lies on the not too distant horizon.
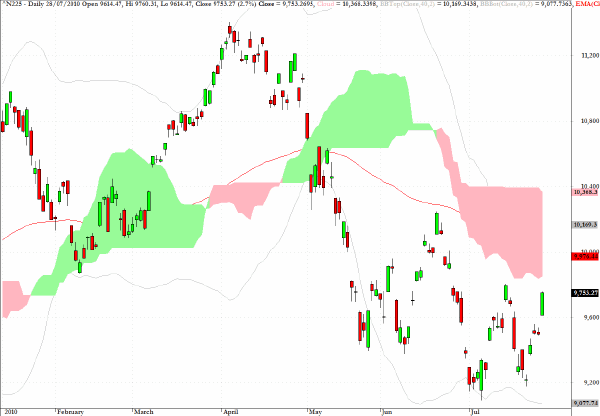
One of the most predictable inter-market relationships is between the yen’s performance and the Nikkei 225. As the yen retreats so the Nikkei rallies in almost 100% correlation. Trading in Tokyo on Wednesday fitted the bill exactly with a 2.7% rise.
The rally may find some resistance at the base of the pink cloud, but, if as I suspect the yen has further to retreat, we could see 10,000 on the Nikkei as we enter August.
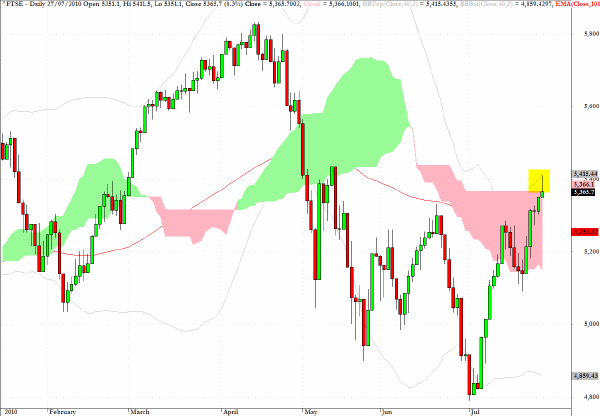
One of the challenges in committing one’s thoughts about the markets to a daily chronicle is that it is easy for someone to point back to previous errors of judgment, and there are certainly enough to be found. But there have been some good calls as outlined below.
The last time I discussed the FTSE 100 was on July 13, and the reference can be found here.
I suggested then that the index would make it to the 5366 level which is exactly where it closed yesterday with a tail above the cloud.
Also discussed in this column on July 6, for which the reference can be found here, was a prognosis that gold and the miners seemed vulnerable to a setback
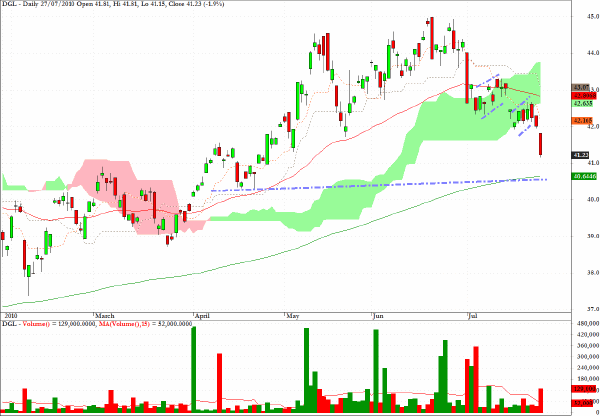
The action in DGL is following a downward staircase pattern, but if you are short I would be exiting close to current levels as the 200-day EMA lies just below the steep drop yesterday. For the time being, apart from retiring short positions I would stand aside.
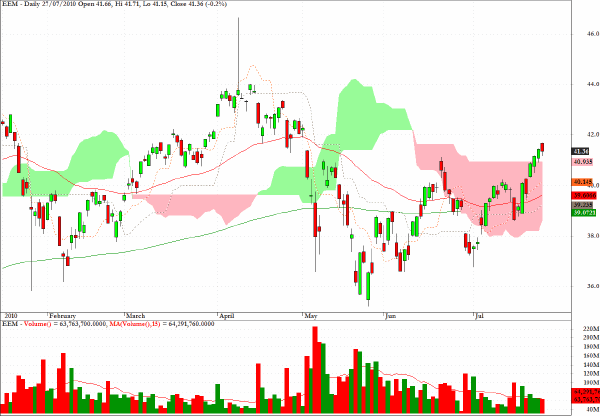
Although in the longer term my allocation preferences for equities are very definitely in favor of the emerging markets rather than US and European sectors, the lack of volume in the EEM sector fund suggests that there is not a lot of passion for these new economies at present. India and Brazil are showing signs of overheating with interest rate hikes now on the front burner, and I intend to remain flat for the BRIC sector for the time being.
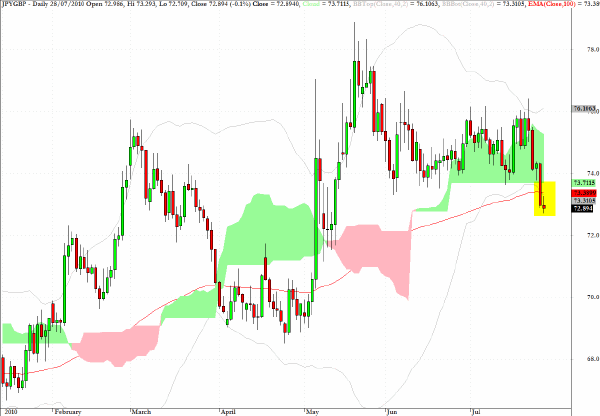
In yesterday’s session, which I actually found to be more interesting than a simple review of the closing prices on many charts would suggest, I was in and out of the GBP/JPY cross rate.
Essentially I misjudged the fact that sterling would be quite so aggressively bid up against not only the yen but also the euro as the data from the UK continues to be surprisingly good. Overall I ended up the session giving back all of the gains I made earlier in the session from shorting the pair.
As can be seen on the chart below - which again is an inverted view of the more customary presentation - the drop below the cloud and the 200-day EMA is significant. For now I would rather see further confirmation that this was more than a lot of Canary Wharf shenanigans before positioning myself on the long side of this pair as the euro based currencies (and I include sterling in that category) continue to rise against the yen.
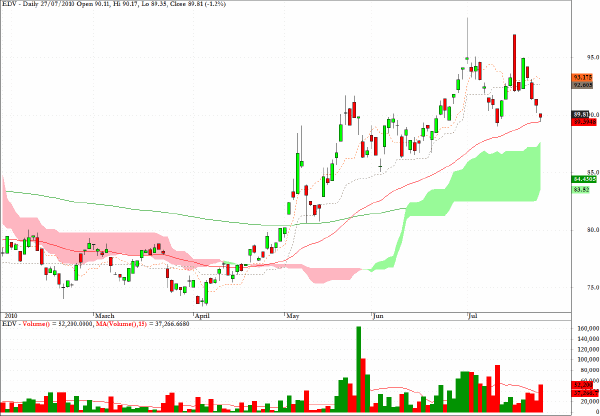
The exchange traded fund EDV, which represents a play on long-term Treasury prices, could have delivered a good profit on the short side as suggested here in early July.
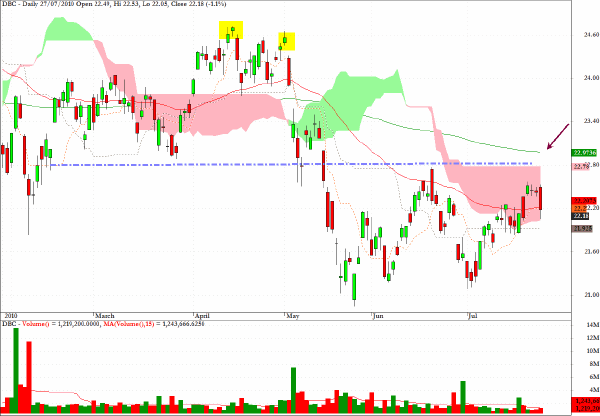
DBC, a sector fund tracking overall commodity prices, has failed again to take on the $22.80 level.
Clive Corcoran is the publisher of TradeWithForm.com, which provides daily analysis and commentary on the US stock market.
|