| Corcoran Technical Trading Patterns For July 29 |
| By Clive Corcoran |
Published
07/29/2010
|
Stocks
|
Unrated
|
|
|
|
Corcoran Technical Trading Patterns For July 29
Yesterday I talked in terms of a volumeless rally in US equities and today I would like to flip that over and talk about a volumeless correction.
The indications in the early part of the session, following weak economic data, were that the bears were seizing the initiative to push the S&P 500 back down for a test of the 1095 area. However there was no dynamism to the move and no volume to the selling. The S&P 500 bounced off the base of the cloud and still seems to be set to gyrate its way through the cloud towards an eventual testing of 1130.
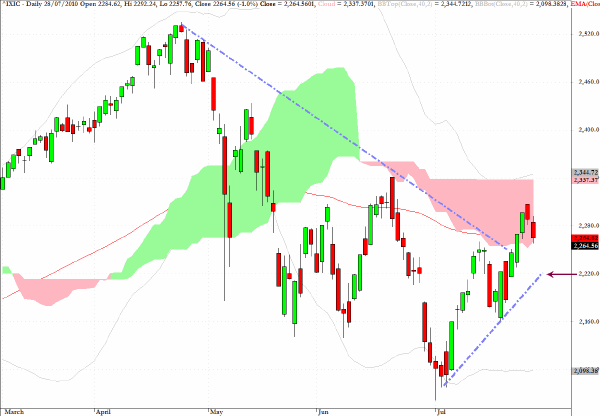
The daily chart for the Nasdaq Composite seen below shows a slightly different perspective using Ichimoku formations as guidelines. Yesterday’s close also tested the bottom of the cloud and survived the test (just), but as can be seen on the chart the level indicated by the arrow 2220 may be a more critical test for this index. As with the S&P 500 the very flat top of the cloud at 2337 suggests that this will also pose quite a hurdle if the bulls keep control of the agenda.
My favored speculative scenario or exercise in dreamscaping (by the way, in my estimation, Inception is a very good movie) for price developments going forward is for a gentle upward bias for equities and risk assets through August but with gathering clouds for risk aversion (see below for the FX perspective on this) as we move into September.

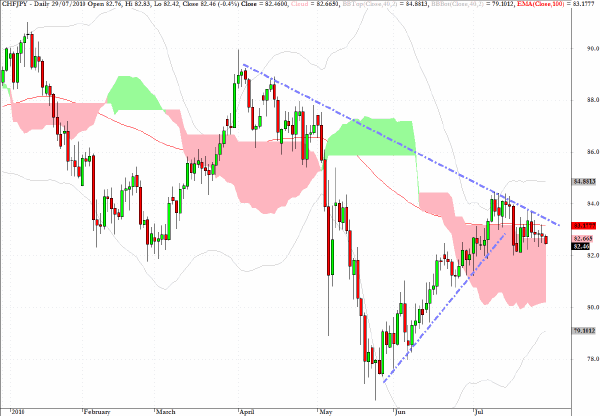
The daily chart below for CHF/JPY indicates that this pair is poised at quite a critical juncture. The fact that recent closes have dropped below the ascending trend-line and that yesterday’s close has pierced the top of the cloud should be monitored closely in coming sessions.
As suggested this cross rate is a good indicator of two things:
1. Likelihood of a safe haven play to the yen, especially since the Swiss franc is also considered a safe harbor during troubled times
2. An early warning that EUR/JPY may also be susceptible to downside (as is the case now) or upside as has been the case previously.
I shall discuss this chart later today on CNBC’s European Closing Bell .

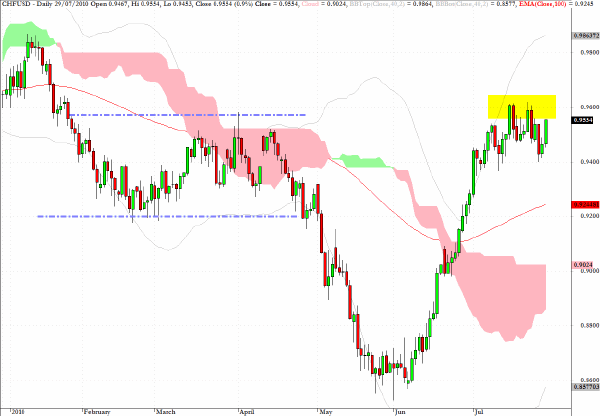
Also up for discussion on the TV slot will be the chart of CHF/USD which shows the relationship from a Swiss franc basis with the US dollar.
Again the advice would be to watch this closely as a failure to break above the recent highs at 96 would lend some weight to the view that we could be entering in the coming weeks(i.e. possibly late August/early September) a period when the Swiss franc would lose ground to both the Japanese yen and the US dollar. This scenario would almost certainly be an accompaniment to a period of risk aversion.

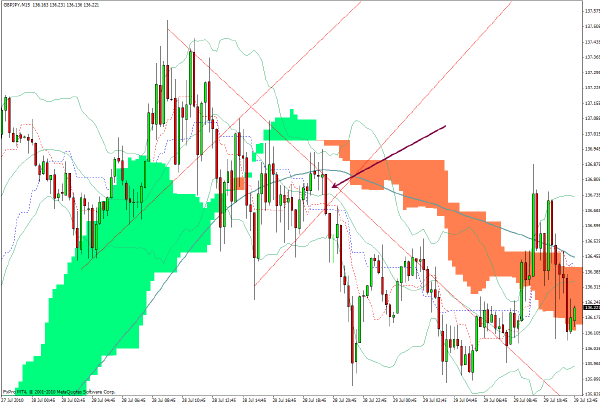
The 15-minute chart below for sterling/yen or GBP/JPY shows a profitable setup for the short trade on the pair which eluded me on Tuesday, as discussed in yesterday’s column, but which turned out to be a very profitable trade for me yesterday, in a relatively brief time frame.
The parallel upward sloping lines and the clear downward trendline through the highs provided the clue to the imminence of the breakdown. The point marked by the arrow represents the decision point and the long red candlestick provided me with the entry signal on the short side. The selloff was abrupt with a quick gain more than sixty points.

Clive Corcoran is the publisher of TradeWithForm.com, which provides daily analysis and commentary on the US stock market.
|