| Corcoran Technical Trading Patterns For August 2 |
| By Clive Corcoran |
Published
08/2/2010
|
Stocks
|
Unrated
|
|
|
|
Corcoran Technical Trading Patterns For August 2
The S&P 500 futures have made good progress since Friday’s close and have been energized by a buoyant mood among traders in European equities as well as a 1.8% gain on the Hang Seng index in Asian trading.
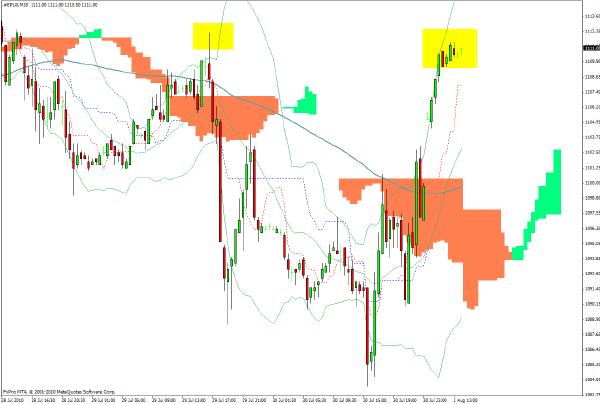
The current level for the S&P mini, as captured on the 30-minute chart, reveals a stalling pattern at 1112.
As previously discussed, the 1130 target seems likely to be tested in coming sessions but with the possibility of more defensive positioning ahead of the NFP data, the risk/reward on the long side for US equities this week does not seem attractive enough for position traders as opposed to intraday traders.
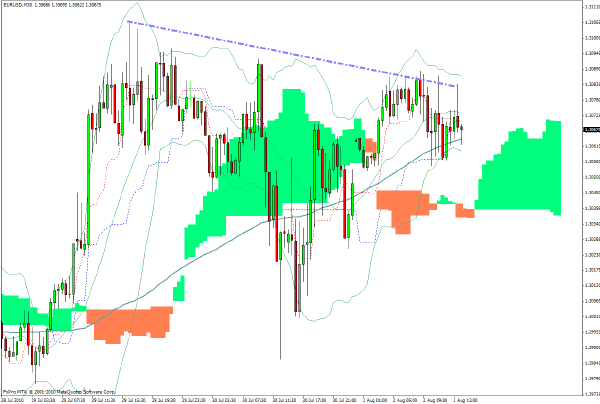
EUR/USD is range-bound and has still failed to make any progress above the $1.31 level, and there is evidence of a series of declining recent highs. If the euro can provide a sharp upward surprise move, which is not too unlikely given thin volumes in FX at present, then $1.3140 becomes the target.
On the other hand, a break below $1.30 would set $1.2880 in play.
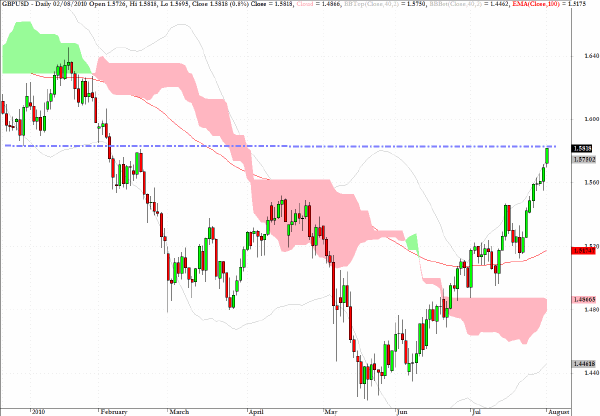
The standout performer among the major currencies during the last few sessions has been sterling which is now contemplating a push up to the long-term pivotal level of $1.60.
There is quite a lot of resistance to overcome at $1.58 but thin volumes could see a sharp rise towards $1.60 at which point the risk/reward ratio would favor the short side of GBP/USD and most crosses involving GBP as the base currency.
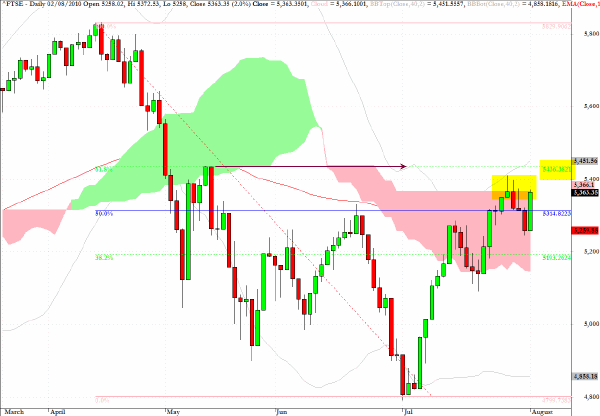
Once again the FTSE is back to the 5366 level suggesting that this level is both an attractor and a hurdle.
If this level can be breached the next target is the 50% retracement on the chart below at 5436.
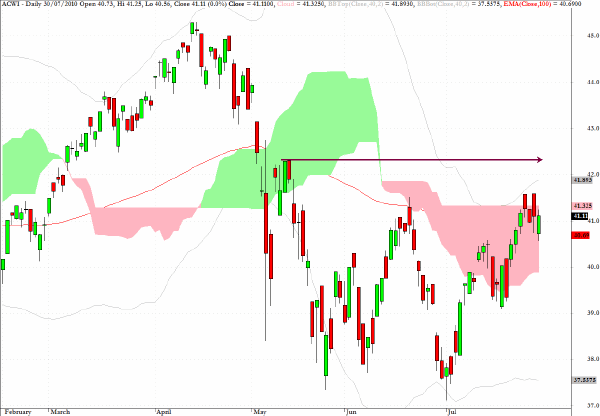
ACWI, the exchange traded fund which tracks the MSCI All Country World index, may be set to challenge the level indicated by the arrow on the chart. This level has significance as the level at which the bounce following the abrupt sell-off in May ran out of steam.
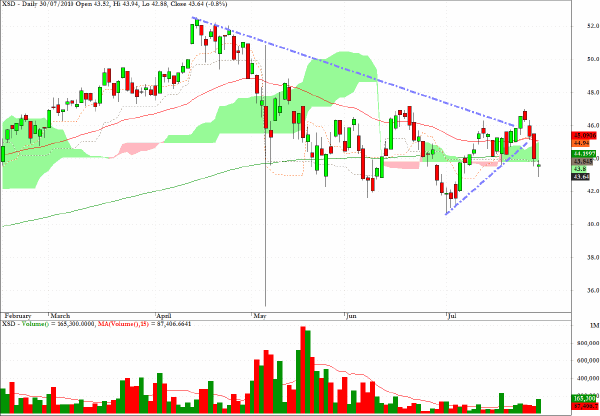
XSD, which tracks the semiconductor sector, has one of the least positive technical patterns among the major ETF’s
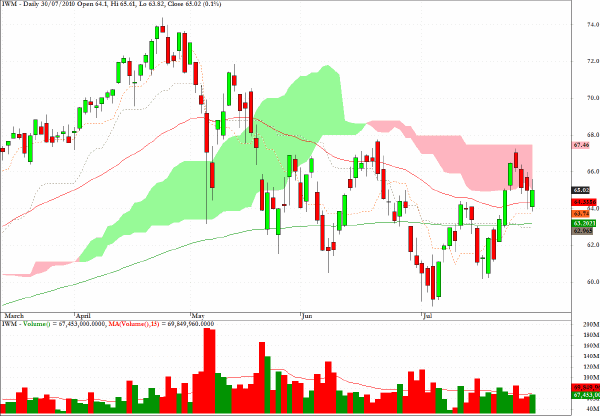
IWM is the exchange traded proxy for the Russell 2000 and the top of the cloud pattern, equating to around 680 on the actual index, would be a feasible target while the overall appetite for risk remains intact.
Clive Corcoran is the publisher of TradeWithForm.com, which provides daily analysis and commentary on the US stock market.
|