| The Wagner Daily ETF Report For August 3 |
| By Deron Wagner |
Published
08/3/2010
|
Stocks
|
Unrated
|
|
|
|
The Wagner Daily ETF Report For August 3
Stocks got off to a great start Monday morning, as most broad market averages gapped more than 1% higher on the open. The opening hour of trading set the tone for the session, as stocks followed through to the upside on strong internals. After a few hours of choppy action in the early afternoon, stocks pushed to new intraday highs after 2 p.m., but failed to extend and chopped around once again into the close. Despite the lack of a strong follow through in the afternoon, the major averages closed with impressive gains across the board. Backed by strong gains in commodity based stocks, the S&P 500 led the charge higher with a 2.2% gain, while closing back above its 200-day moving average. The Dow Jones Industrial Average put in a strong 2.0% move. The S&P Midcap 400 and Nasdaq Composite gained 1.9 and 1.8% respectively. The small-cap Russell 2000 was a surprising laggard throughout the day but still managed to gain 1.7%.
The one key ingredient missing from yesterday's strong move was volume. Turnover sank on both exchanges. NYSE volume fell 7% off the prior session's pace, while Nasdaq volume came in 10% lighter. Since the July bottom in the market, the S&P 500 has yet to produce a strong volume accumulation day with volume coming in at or above its 50-day moving average of volume. Market internals were strong all session long, with the a/d ratio's closing at 13 to 1 on the NYSE and 5 to 1 on the Nasdaq. The buying was definitely broad based, as just about every sector we follow closed in positive territory. On our industry group list, gold stocks were the only weak link, as they closed down 0.4%.
The market appears to be gaining some traction as of late, as we are beginning to see important sector ETFs hold key support levels and break above key resistance levels.
SPDR KBW Bank ETF (KBE) is forming an inverted head and shoulders bottoming pattern over the past few months. It's now trading back above all the main averages, which are clustered together around 24.00 on the daily chart below:

Yesterday's gap up put KBE over the short-term downtrend line, so we should see a test of the 25.50 level within the next few days. A breakout above this level is the obvious confirmation of the head and shoulders bottoming pattern. We may just see a lot more choppy price action before there is a significant rally, but overall, we like the action off the 200-day MA.
HOLDRS Semiconductor ETF (SMH) has also held the 200-day moving average over the past few weeks. Last Friday's slight undercut of the 200-day MA followed by Monday's gap up back above the 50-day MA is encouraging action. Though this ETF is clearly still rangebound (from 27.00 - 29.00), it appears to be building a solid foundation with the right side of the base potentially setting a higher low.

The price action in the retail sector is picking up, as the SPDR S&P Retail ETF (XRT) has broken above the downtrend line and the 200-day moving average. After testing the 200-day moving average last week, yesterday's gap up closed back above the 200-day and 50-day MA's. XRT did not show any relative strength during the market selloff, so we do not expect retail to be a source of leadership; however, it is important for XRT to hold the 200-day moving average.

REITs have shown quite a bit of relative strength as of late. The iShares Dow Jones US Real Estate Index (IYR) is already trading near the highs of April.

IYR's undercut of the prior lows and 200-day MA in early July sparked a bullish reversal. Buying the breakout here is a bit too obvious, so one could wait for a pullback to the rising 20-day EMA as a low-risk entry point.
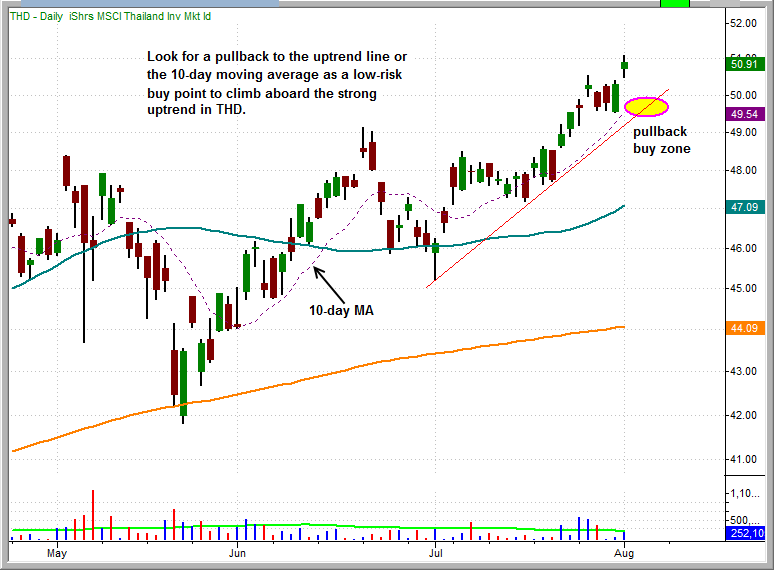
As mentioned last week, most of the relative strength ETFs are emerging markets. The iShares Thailand ETF (THD) has already broken out to new 52-week highs. The 10-day MA is usually a low-risk buy point whenever there is a strong uptrend in place and the 20-day EMA is a bit too far away. Look for a pullback to the 10-day MA to coincide with a test of the short-term uptrend line.

Open ETF positions:
Long - UNG, TLT, TAN
Short (including inversely correlated "short ETFs") - GDX
Deron Wagner is the Founder and Head Trader of both Morpheus Capital LP, a U.S. hedge fund, and MorpheusTrading.com, a trader education firm.
|