| Corcoran Technical Trading Patterns For August 4 |
| By Clive Corcoran |
Published
08/4/2010
|
Stocks
|
Unrated
|
|
|
|
Corcoran Technical Trading Patterns For August 4
On Wednesday morning European equities have moved down across the board with the FTSE down 75 points or 1.4% at the time of writing. The S&P futures are also in retreat with the September contract trading at 1113.50 but the real story continues to be the strength of the Japanese yen which is almost at 15-year highs against the US dollar. Driving the yen higher is the ongoing decline in US Treasury yields with the 2-year note trading at a record low of 0.534% earlier this week and the ten-year note still well below 3%. The inevitable impact on the Nikkei 225 is discussed below, but perhaps even more remarkable is the fact the yield on the 10-year JGB dipped below 1% in trading Wednesday a level not seen since 2003.
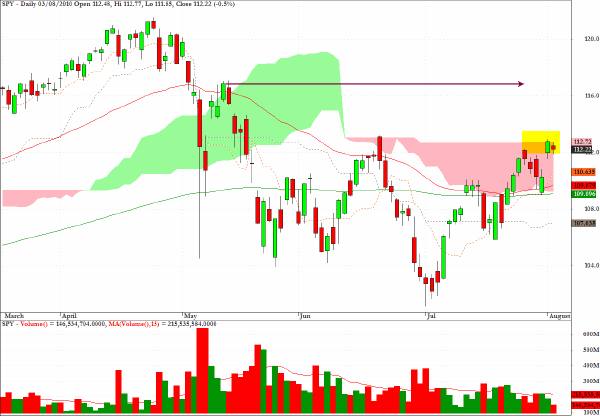
The chart for the SPY proxy shows that the ETF has tested the top of the cloud formation in the last two sessions, unlike the S&P 500 cash index where the very flat cloud top is at 1130 almost exactly.
The volume remains anemic and this can be both a cause for caution and also a sign that with thin trading conditions during August the path of least resistance may well be upwards to 1130 and beyond.
My concern is that there is little institutional participation in the market at present with most of the action best characterized as a ping/pong match between prop desks shuffling through their ETF correlation strategies.
Looking ahead, the next level of potential resistance, assuming that the illiquidity pockets beneath the algorithmic activity do not give way, would be the level indicated on the chart below which is where SPY found resistance after the most recent attack of algo vertigo in May.
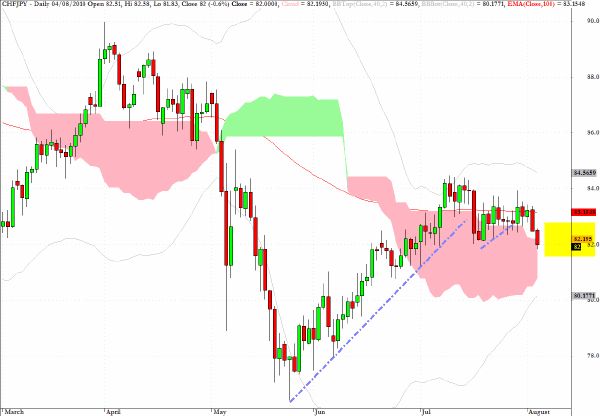
I shall be watching CHF/JPY closely today as a clear break below 82 would suggest that the yen’s strength may be causing misalignment anxiety among some large macro asset allocators.
The daily chart pattern below looks quite bearish with two violations of key ascending trend-lines.
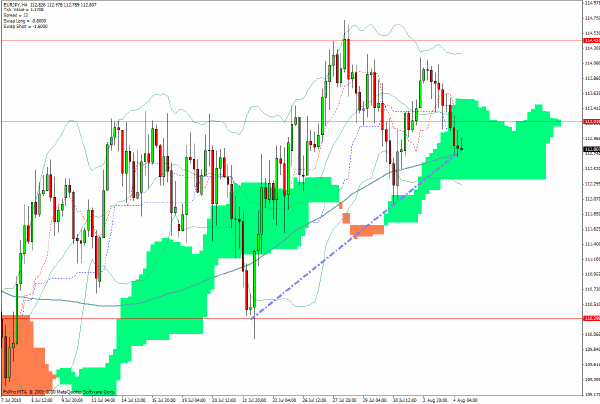
EUR/JPY is also critically poised and, from an intermediate-term perspective (i.e. the next 72 hours), I would be targeting the base of the cloud around 112.40 following the failure to move back to the top of the range indicated on the 240-minute chart below. However, I would be looking for an entry point around 113.50 before pulling the trigger.
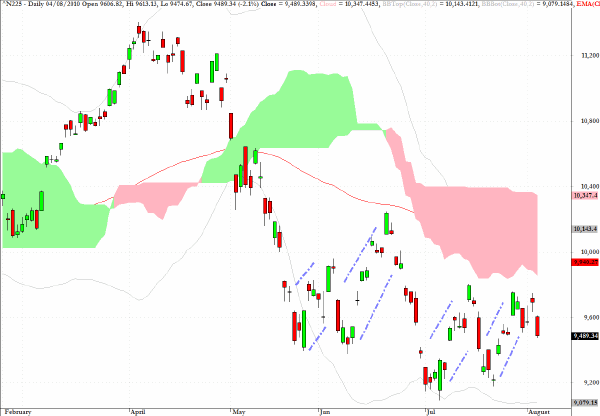
The Nikkei 225 responded to the yen’s strength with another selloff.
Looking at the pattern below, it is clear how much Japanese equities react to movements overnight (from their perspective) in the FX market. The series of bearish flag patterns is not encouraging, but the 9200 level has provided support at the bottom of a fairly clearly defined range of 1000 points which has been in effect since November 2009.
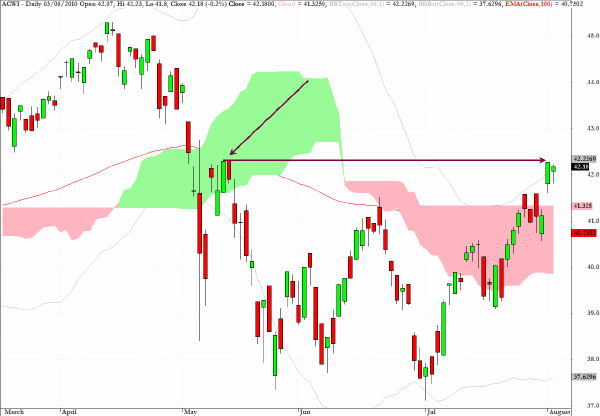
My comments from Monday regarding ACWI seem worth repeating:
ACWI, the exchange traded fund which tracks the MSCI All Country World index, may be set to challenge the level indicated by the arrow on the chart. This level has significance as the level at which the bounce following the abrupt selloff in May ran out of steam.
In the developing markets, inflationary pressures are beginning to create a tighter monetary environment which is having a spillover effect on equities.
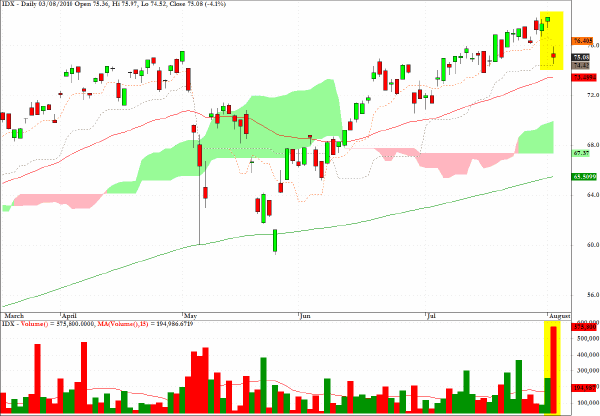
IDX, is a geographical sector fund for the Indonesian market, and as the chart shows this market sold off hard on heavy volume as recently released economic data is requiring the central bank to stay ahead of the inflation genie, which once it emerges from the bottle is hard to get back in. However this is a difficult juggling act as increasing short term rates could also spook a lot of the adventurous capital which is flowing into its equity markets.
I would suggest that the fund could be vulnerable to another drop, but would wait for entry until a pullback towards the recent high has taken place.
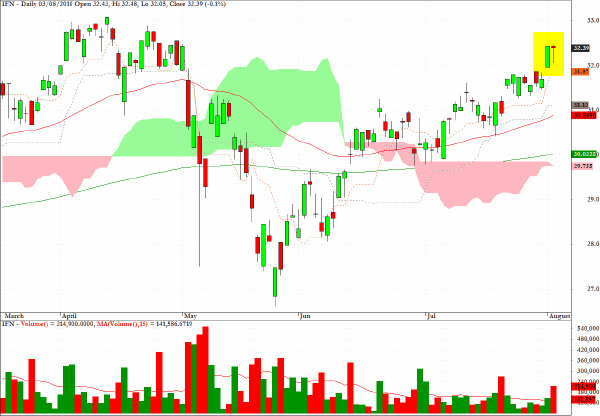
The India Fund (IFN) has shown great relative strength amongst geographical sector funds, but similar inflationary issues to those discussed above could also point to the fact that the risk/reward ratio for this sector - which is at the top of its range - is no longer in favor of the bullish case.
Clive Corcoran is the publisher of TradeWithForm.com, which provides daily analysis and commentary on the US stock market.
|