| Corcoran Technical Trading Patterns For August 6 |
| By Clive Corcoran |
Published
08/6/2010
|
Stocks
|
Unrated
|
|
|
|
Corcoran Technical Trading Patterns For August 6
Most of the attention today will be focused on how US equities react to the NFP data, but there are some other key indicators that deserve attention, specifically the US dollar and the Japanese yen.
I have never been a big fan of the US Dollar Index for the simple reason that it contains a basket of currencies that do not perform in a consistent manner with respect to the US currency. In particular, the yen moves to a very different drummer’s beat than most other currencies.
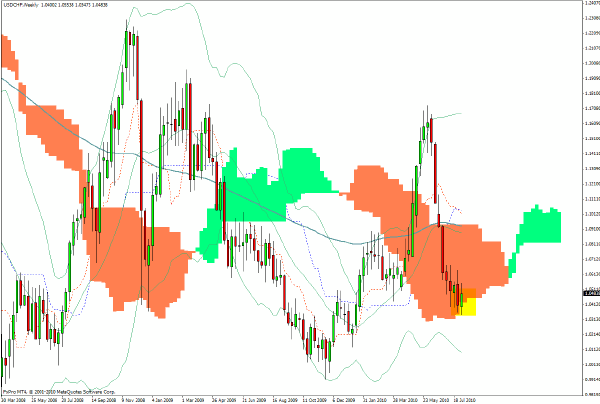
Of particular interest today will be the USD/CHF pair. A case can be made from reviewing the weekly chart below that after the very steep correction, from an Ichimoku perspective, the US currency could be in a slow basing pattern against the "best behaved" currency, the Swiss franc.

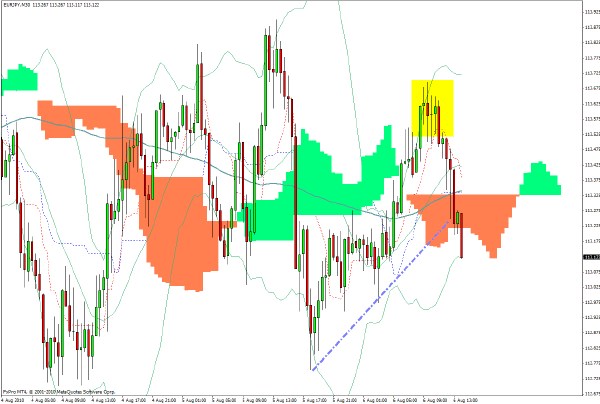
EUR/JPY failed to make much headway above 113.50 and once again I would suggest that the trend line below, which looks "broken" in the short time frames is confirming the longer time frame charts which point to an intermediate-term top having been made around 114.60 in July.

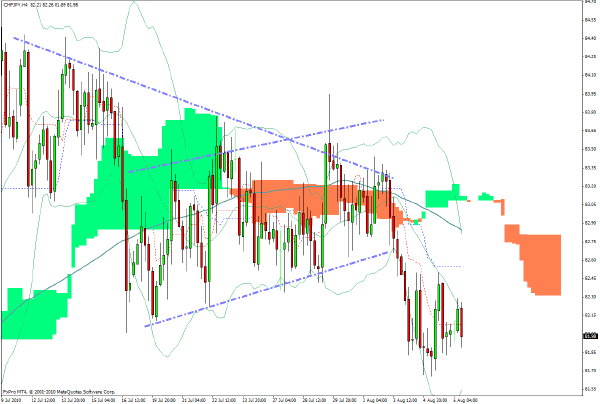
The 82 level on CHF/JPY has been a pivotal level for these two "safe haven" currencies. The way that the yen reacts later today in regard to the economic data, not only with respect to the Swiss franc but also the euro, could set the tone for several asset classes during August.
If there is a further flight to US Treasuries and the yen moves up against the Swiss franc after the NFP data, then I would suggest that it would strengthen the case for a September sell-off in equities.

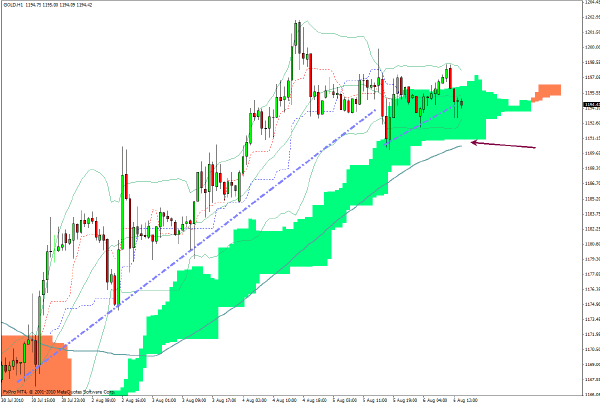
If spot gold breaks below 1190 and the 60 minute cloud formation then there could be further manifestation of the recent corrective behavior.

Clive Corcoran is the publisher of TradeWithForm.com, which provides daily analysis and commentary on the US stock market.
|