| Corcoran Technical Trading Patterns For August 13 |
| By Clive Corcoran |
Published
08/13/2010
|
Stocks
|
Unrated
|
|
|
|
Corcoran Technical Trading Patterns For August 13
During my two-day absence the complexion of the equity market has deteriorated substantially with Wednesday’s selloff leading to violations of some key uptrend lines on many sector funds and indices.
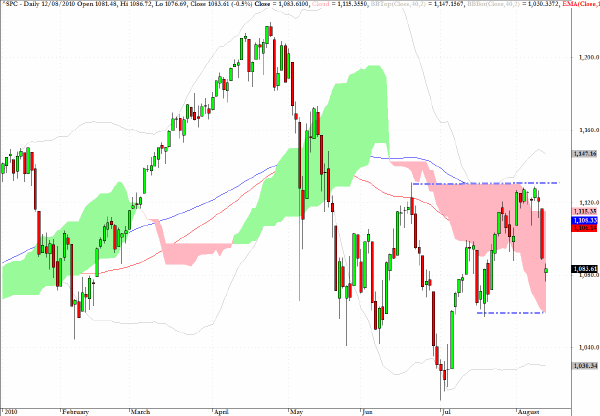
The S&P 500 broke through key support levels at 1093 and 1085 but the futures managed a "bounce" off of the 1070 level which saw the cash index hold above 1075.
At the time of writing the eMini futures are trading with a negative tone and the September contract is hovering in the vicinity of 1080 after failing to break above 1090.
The outlook for the remainder of the year is not constructive and a break below the previous recent low of 1013 (also the 38% retracement level discussed here on Monday) could create a downward price cascade.
My expectation is that the base of the cloud and the 1050 level will need to be tested soon. Depending on whether or not there is any accelerated institutional liquidiations, the bulk of the trading for the remainder of August is likely to be almost exclusively in the domain of algorithmically driven strategies (it is most of the year anyway but more so in August) and this might have a slightly moderate bias which could still produce a surprise visit up towards 1130 again.
For latter September and Q4, I suspect that the headwinds of deflationary pressures will prove too strong and the bears will take control of the agenda.
All of the yen crosses got crushed in Tuesday’s and Wednesday’s session which echoed my warning here on Monday regarding EUR/JPY and CHF/JPY.
The technical pattern which had been developing for CHF/JPY during July was clearly pointing to an impending slide of the Swiss franc against the yen and there were even worse technical conditions for EUR/JPY and GBP/JPY as I have previously observed.
Substantial profits have been earned over the last 72 hours from favoring the short side of these crosses, and I hope that you will have taken the recommendations on the recent occasions -including Monday - when I have drawn attention to this.
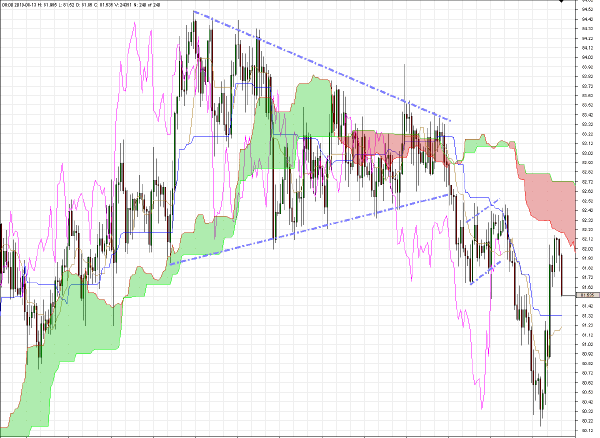
The uptrend line for EUR/USD has been critically broken on the 240-minute chart below and there is now clear overhead resistance at $1.3150, and I would not be surprised to see $1.2740 - the level indicated on the chart - in the coming days.
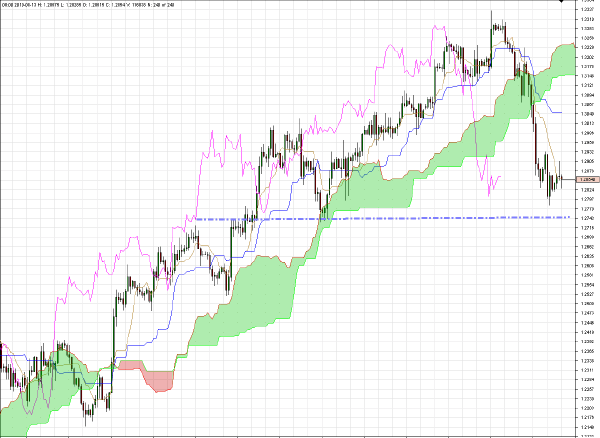
The technical picture for GBP/USD looks as dire as that for the euro and the two most notable features on the chart, apart from the upward trend violation, are the failure at exactly the $1.60 level and the absence of any real price support until the $1.52 area, although there is minor support around $1.5450.
On the EUR/GBP cross the 82 level is being tested this morning in Europe as it was in yesterday’s session. There was an aggressive amount of cross rate trading at this level yesterday but 82 held and was followed by a sharp recovery as the euro retained its poise against sterling. Expect the level to be tested vigorously in coming sessions and a break below 82 would be a bad omen for the euro, especially given the fact that sterling is acting poorly as well.
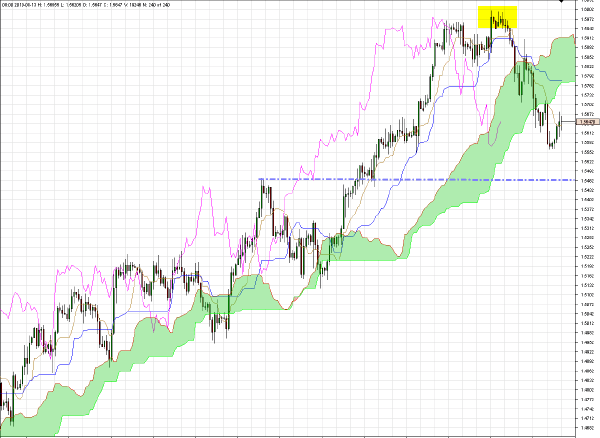
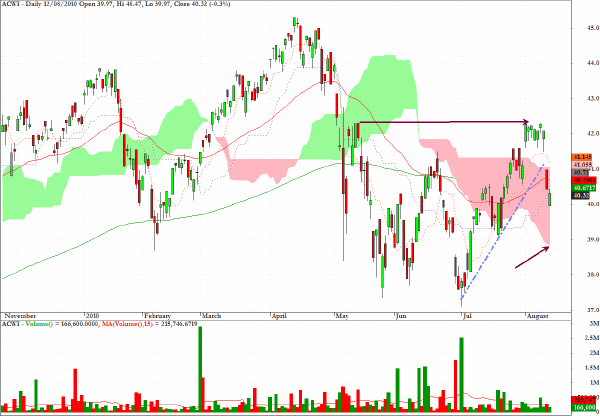
ACWI failed to break above the level I discussed here as indicated by the arrow on the chart, which was the bounce level following the May 6 plunge.
As with many indices the MSCI World Index gapped down substantially on Wednesday and now faces a potential visit to test the base of the cloud formation.
Here again are my comments from my Daily Form commentary of July 22.
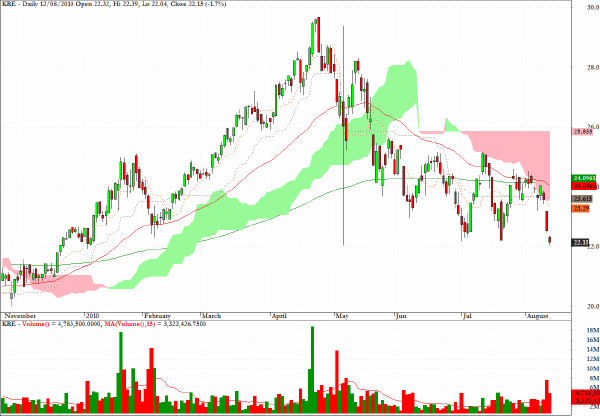
Perhaps as a foretaste for what lies ahead for the banking sector and XLF as just discussed, can be seen in the daily chart for KRE, a sector fund which acts as a proxy for the regional banking sector. Yesterday KRE broke to a new multi-period closing low and almost touched the level seen in the May 6 "flash crash".
I am reminded of all of the skeptics who claimed that the May 6 low was an aberration and of all the misguided chatter about "fat finger" traders etc. It turns out that the intraday prints on the ETF charts from May 6 have been extraordinarily prescient in anticipating where certain sectors were headed.
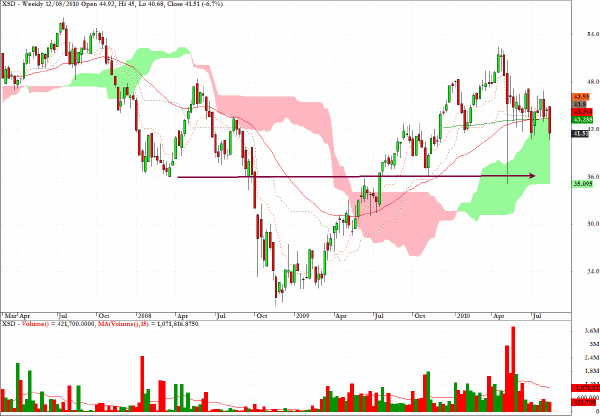
On August 2 I noted that XSD had one of the least favorable technical patterns of the major ETF’s and the semiconductor sector has been hit hard over the last few sessions.
On the weekly chart the $36 level would seem to be a feasible target for position traders looking at the longer-term horizon.
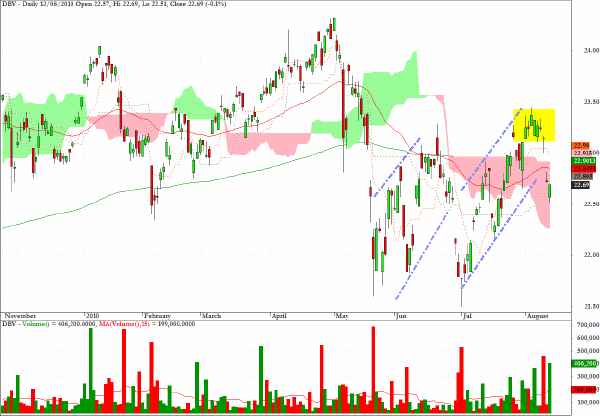
The sector fund DBV, a proxy for the FX carry trade, shows that this is not the place to be when risk aversion moves to the foreground.
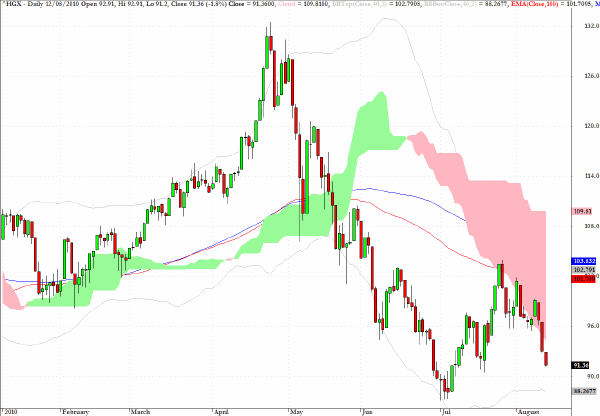
The Housing Index (HGX) has clearly broken loose not only from its recent uptrend but even below the daily cloud formation suggesting that even a consolidation pattern now would seem unlikely.
It is extremely difficult not to be negative about the outlook for US real estate and the homebuilders and those regional banks which are most exposed to the sector and which do not qualify as TBTF (i.e. Too Big to Fail).
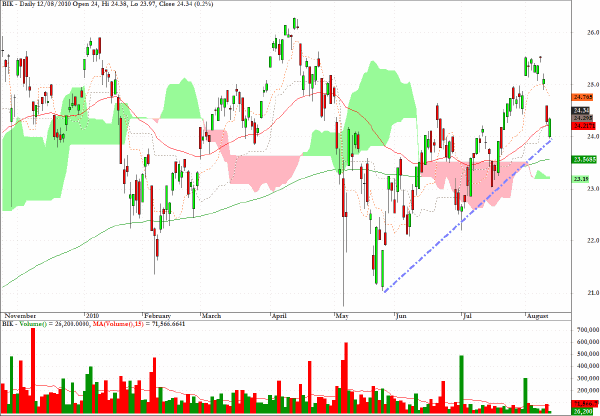
BKF, one of the main sector funds which track the BRIC economies, has one of the least negative looking charts for those who want to play the long side.
Clive Corcoran is the publisher of TradeWithForm.com, which provides daily analysis and commentary on the US stock market.
|