| Corcoran Technical Trading Patterns For August 18 |
| By Clive Corcoran |
Published
08/18/2010
|
Stocks
|
Unrated
|
|
|
|
Corcoran Technical Trading Patterns For August 18
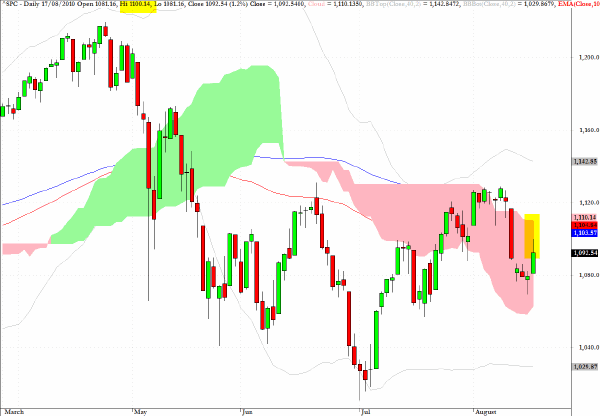
The fact that the S&P 500 has not sold off following the very weak data released recently, and some widely publicized technical divergences, is confounding many of those who were getting aggressively short following the selloff a week ago.
The failure to break above 1100 yesterday was perhaps a minor setback but as we drift towards Labor Day in the remaining hazy days of the summer (not in the UK where summer occurred on July 22 to be exact) there could well be a tendency to move up to the top of the cloud formation on the daily chart.
As can be seen, given the way that the cloud formations are a forward projection of past data, the top of the cloud has shifted from the very flat top at 1130 which persisted for some time towards the 1110 level which is little more than 2% from current levels.
1130 would still pose a formidable overhead barrier, if we can penetrate the cloud, but it is also worth considering a further target which I have cited previously, which is around 1170 which was the "bounce" level following the May 6 selloff, and which from a technical perspective would be in need of testing and surpassing in order to add conviction behind a longer-term positive outlook for this index.
I still remain wary of a less hospitable environment for equities as we move beyond Labor Day and approach Q4.
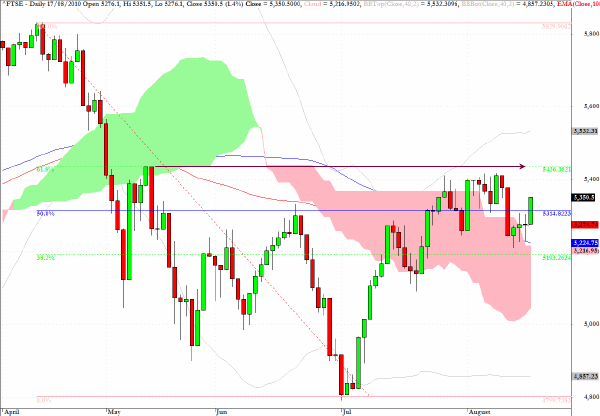
Following similar reasoning to that proposed above for the S&P 500, the 5436 level represents a target for the FTSE in the UK which not only corresponds exactly to the level seen following the early May bounce but also the 62% retracement of the 2010 high and low which are visible on the daily chart below.
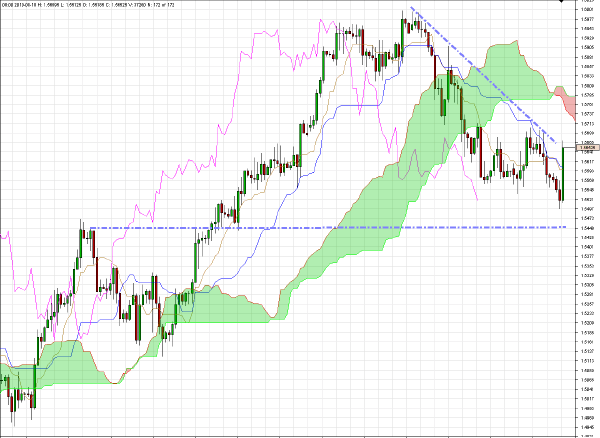
GBP/USD is rallying at the time of writing but faces a trend line of resistance close to 1.5680. Should it make it beyond that level there there would be stronger resistance from the 240-minute cloud formation at 1.5740.
The support level indicated on the chart at 1.5460 held during yesterday’s slide but a failure to break above $1.5740 would suggest another more forceful testing of this support line. As suggested here last week, the $1.52 level would seem ultimately to be an area of stronger support but sterling is tracking the euro closely and the immediate technical outlook for EUR/USD is not easy to discern.
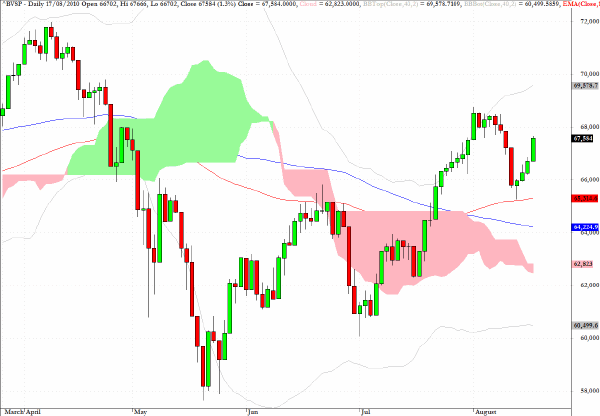
The Bovespa Index in Brazil is making a valiant effort to recover the ground recently lost but in so doing could be in the process of developing a bearish flag formation with vulnerability at the 69,000 level.
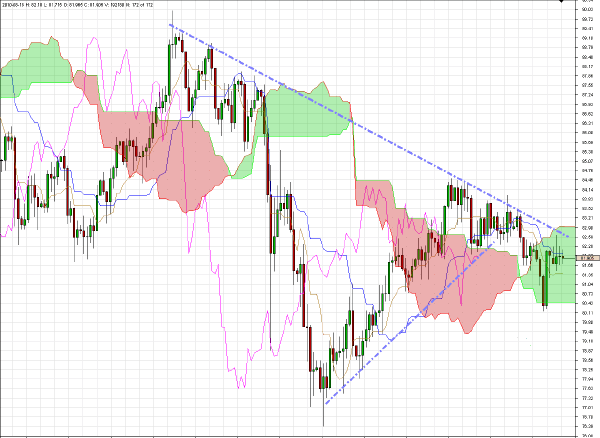
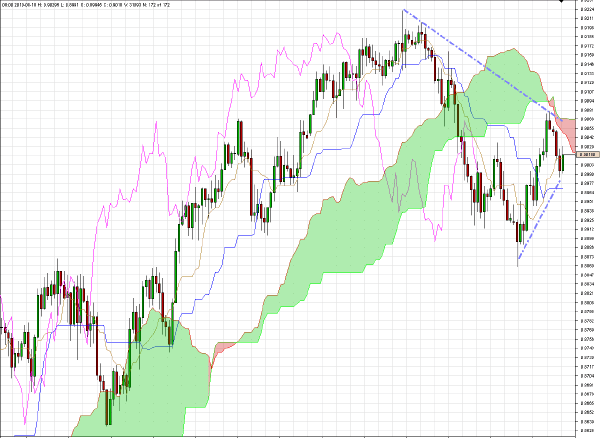
CHF/JPY remains within the cloud on the daily chart below with a lot of resistance to overcome between 82 and 83, while the larger picture still remains one where further yen strength against the Swiss currency seems likely.
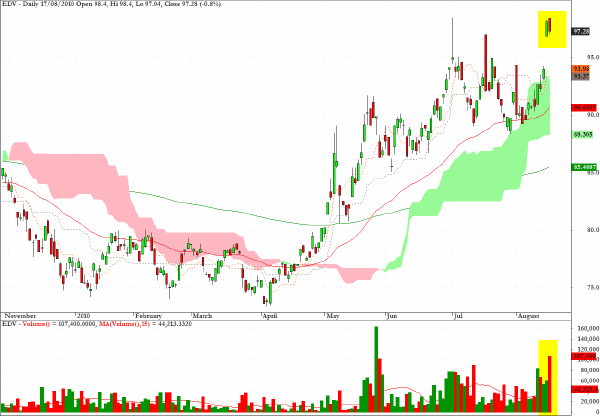
The exchange traded fund EDV, which represents a play on long-term Treasury prices, shows two "island" candlesticks which may be left stranded in the near term. The large volume yesterday highlights the fact that there is a lot of market activity involved in yield curve maneuvers, and the almost uninterrupted increase in prices at the long end of the curve recently may well be setting us up for a corrective move. Another method of exploiting any short-term uptick in yields would be to take a long position in TBT.
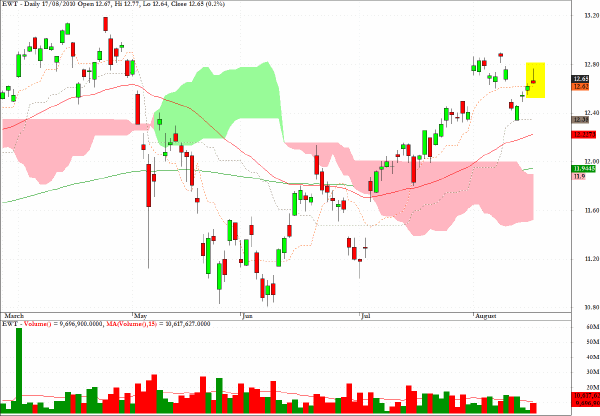
EWT, an exchange traded fund which tracks Taiwan’s equity market, registered a gravestone doji candlestick yesterday and this geographical sector is highly correlated with semiconductor performance which, despite a slight recent rebound, still looks technically weak.
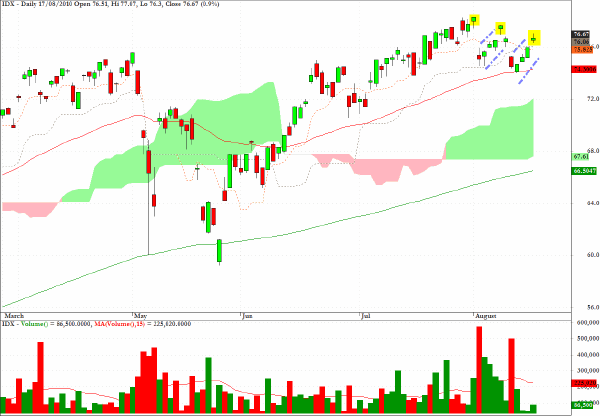
Here again are my comments from the newsletter dated August 4.
In the developing markets, inflationary pressures are beginning to create a tighter monetary environment which is having a spill over effect on equities.
IDX is a geographical sector fund for the Indonesian market, and as the chart shows, this market sold off hard on heavy volume as recently released economic data is requiring the central bank to stay ahead of the inflation genie, which once it emerges from the bottle is hard to get back in. However, this is a difficult juggling act as increasing short-term rates could also spook a lot of the adventurous capital which is flowing into its equity markets.
I would suggest that the fund could be vulnerable to another drop, but would wait for entry until a pullback towards the recent high has taken place.
AUD/USD is moving further into a large frame triangular formation on the 240-minute chart and the overhead resistance from the descending front of the cloud formation is tilting me in favor of a break to the downside when the pattern resolves itself.
Clive Corcoran is the publisher of TradeWithForm.com, which provides daily analysis and commentary on the US stock market.
|