| Corcoran Technical Trading Patterns For August 20 |
| By Clive Corcoran |
Published
08/20/2010
|
Stocks
|
Unrated
|
|
|
|
Corcoran Technical Trading Patterns For August 20
In Friday’s European trading session equities are sliding with both Germany’s DAX and the CAC40 in France down by more than one percent as fears about Greece and other EU sovereign credits are pressuring EUR/USD, which has also just cracked below the $1.27 level. The S&P 500 futures have also broken below recent intraday lows and reached below the 1063 level suggesting that, when trading opens in North America in a couple of hours, we may well be headed down towards the 1050 level which represents a key Ichimoku level on the daily chart.
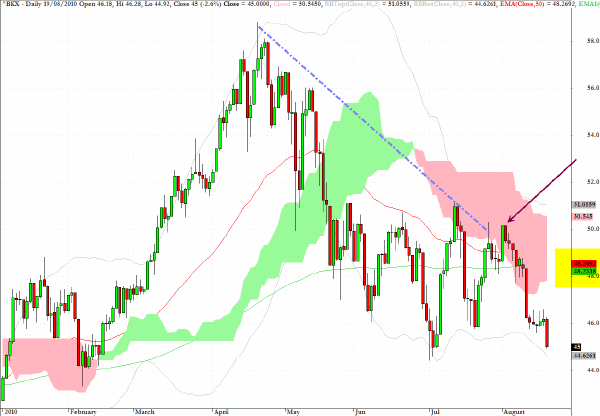
I have included the chart for the KBW Banking Index (BKX) below to illustrate the point of failure for the rally that appeared to be setting up for a summer rally for this sector. The peek above the trendline and the Ichimoku cloud base, once reversed, has set in motion a highly probable retest of the February low for this index. If we don’t see institutional buying support around this level, this will provide another nail in the coffin for the deteriorating outlook for equities in general.
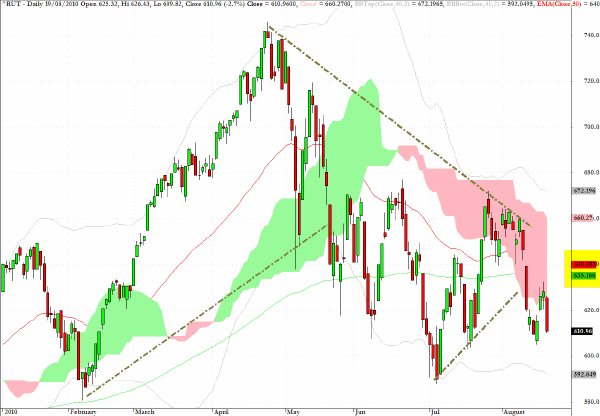
The Russell 2000 Index (RUT) also looks technically weaker than the S&P 500 and the 585 level would seem to be a feasible near-term target. RWM can be used as a proxy for the short side on this index.
As always there is the proviso that inverse ETF funds are useful for near-term position taking with respect to the instruments that they short, but over the longer term, due to the manner in which they are constructed, there is a tracking error which means that holding a long position in an inverse ETF will not match the gains from being outright short that same instrument.
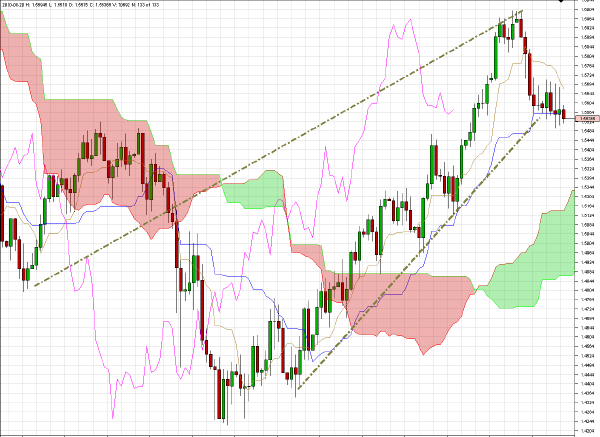
Since starting to put this edition of the newsletter together the euro has broken below $1.27 and sterling has cracked the $1.55 level. Since it is a late August Friday with relatively thin trading conditions, it would be rash to reach any premature judgments, but both levels are key for the longer-term outlook and if we should close out the week with EUR/USD below $1.2740 and sterling below $1.55 this would not only suggest that the tide is turning against these key European currencies but also suggest that the likelihood of a more invigorated US dollar is increasing, perhaps as a corollary to further risk aversion if the retreat in equities gathers pace.
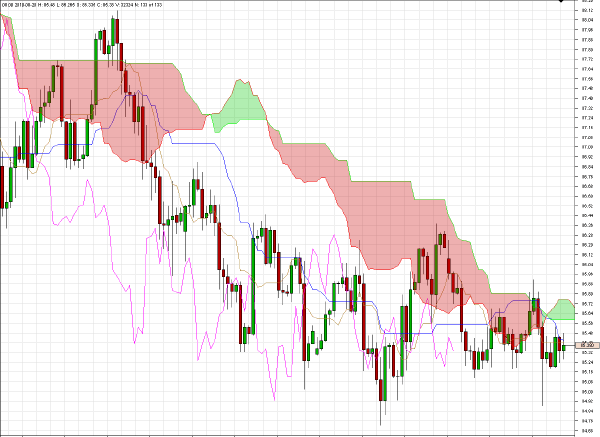
USD/JPY is behaving relatively quietly during Friday’s European session but should be monitored later today for a possible close below the 85 level. If we do close the week with a notably stronger yen then the outlook for the Nikkei in Monday’s session becomes fairly critical as that index closed down almost 2% in Friday’s session and just below the 9200 level.
If the Nikkei drops below 9000 that would be another watershed event which would not be favorable to the already deflated animal spirits.
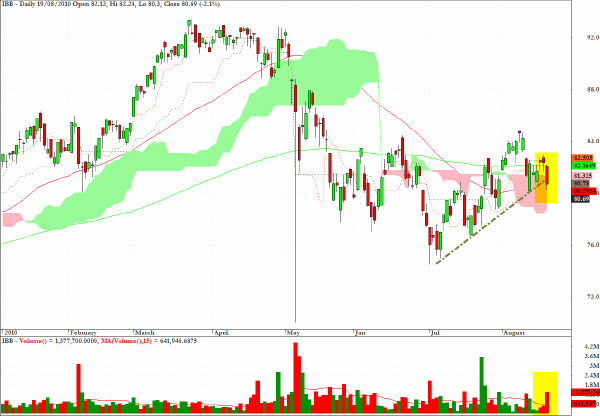
IBB, one of the sector funds which tracks biotech stocks, revealed technical weakness yesterday on a pickup in volume. In addition to the break below the recent trendline the sector broke below both the 50 and 200 day EMA’s and has also entered the pink cloud formation suggesting an increased likelihood of an eventual visit towards the $76 level seen in July.
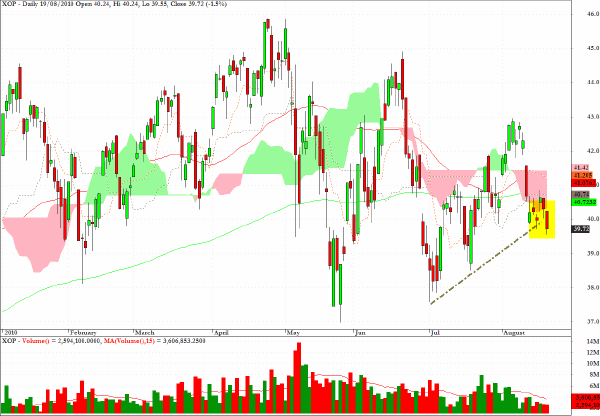
XOP, the exchange traded fund for the oil and gas exploration sector, has dropped below the cloud formation and other technical weakness suggests lower prices ahead.
For premium subscribers there is a daily listing of key ETF’s and equities which have made significant moves in relation to many key technical indicators, including those which have dropped out of Ichimoku cloud formations or emerged from such clouds in an upward direction. Notably at the moment there are very few instruments which are emerging upwards from such clouds apart from inverse ETF’s.
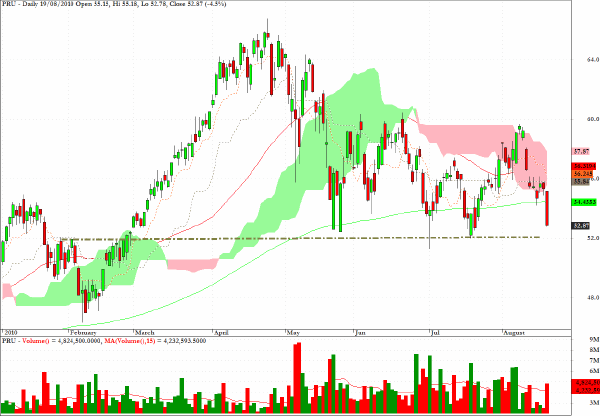
Prudential Financial is acting poorly and may find some support at $52 as indicated by the dotted line. However given the possibility of extended weakness in the financials a failure at this level would suggest another four/five dollars of downside.
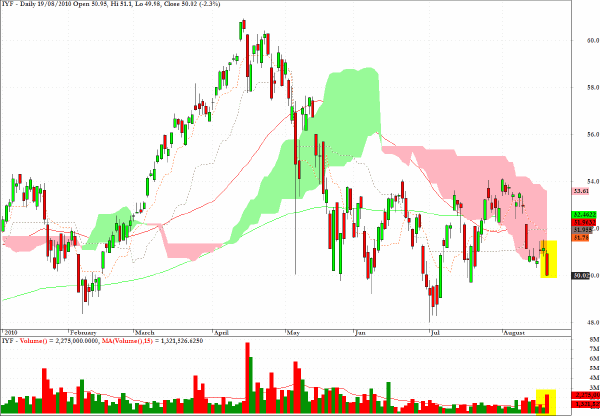
In line with my comments above regarding the key levels from February which are now being approached for the banking sector as well as the micro caps, IYF, which tracks the Dow Jones US Financial Sector Index, should be appealing around the $48 level, provided that long only managers are not yet prepared to throw in the towel.
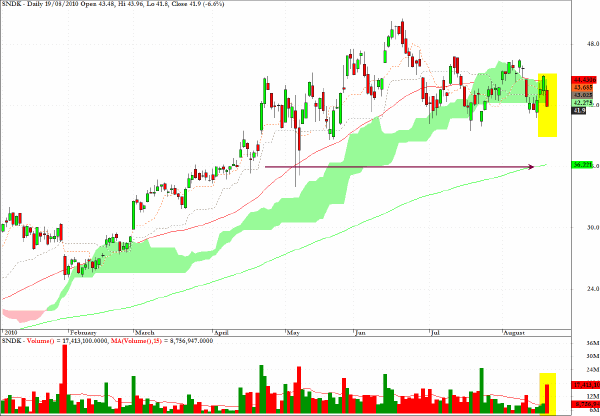
SNDK looks to be headed to an eventual test of the 200-day EMA around $36 after dropping out of the cloud on twice the recent average daily volume.
Clive Corcoran is the publisher of TradeWithForm.com, which provides daily analysis and commentary on the US stock market.
|