| Corcoran Technical Trading Patterns For August 24 |
| By Clive Corcoran |
Published
08/24/2010
|
Stocks
|
Unrated
|
|
|
|
Corcoran Technical Trading Patterns For August 24
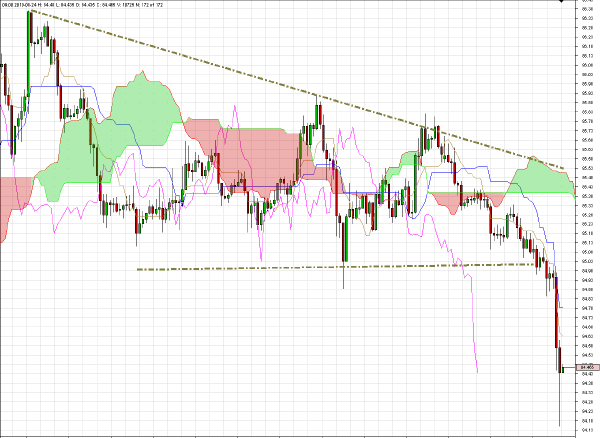
The big event in European trading this Tuesday morning (so far) occurred just after 0700 GMT when USD/JPY dropped almost 100 pips and bounced just before hitting the 84 level. This puts the yen at a multi-year high against the dollar - a fact that reflects the unease which is also keeping the yields on several key government bond benchmarks, including the 10-year bund, at or near historically low levels.
In overnight trading the Nikkei dropped and then closed below the 9000 level and this gives rise to a real possibility that there will be concerted action from the BOJ and other central bankers to try to "manage" the situation as things could get rather ugly from here on.
S&P 500 futures are trading at present down below their close yesterday at 1056.
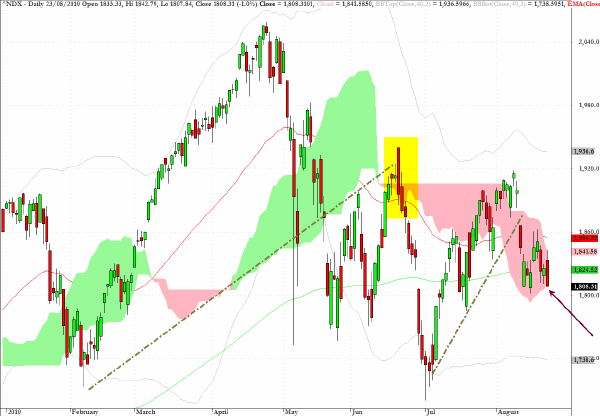
With one week remaining in August and US equities also sliding downwards, the chart for the Nasdaq 100 looks in some ways the most vulnerable and a drop to 1750 could be a realistic target, if not before Labor Day, then soon afterwards.
The technical pattern on the 60-minute chart for USD/JPY is a classic break from a downward wedge pattern and since we are now in uncharted territory on this key exchange rate it would take a braver man than me to guesstimate where we go next. Clearly the BOJ will be watching developments closely and trading this pair at present is high risk in my opinion.
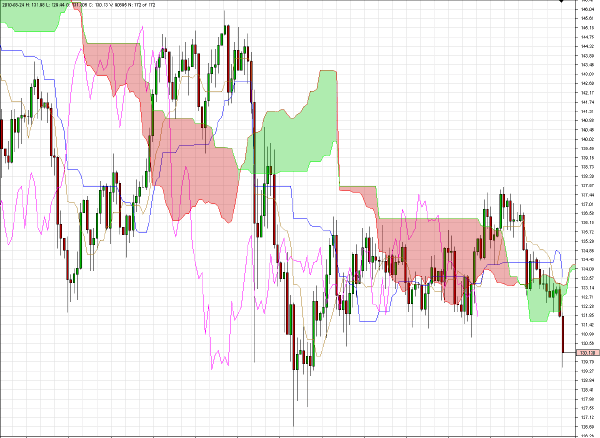
GBP/JPY looks set to revisit the 128 level which was seen in May in the aftermath of the wonderfully prescient "flash crash" event.
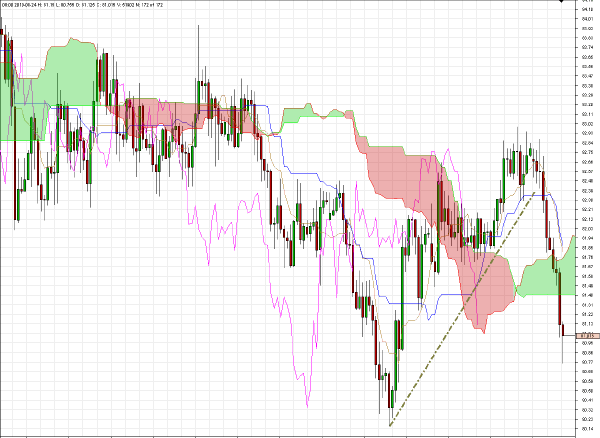
When considering two safe haven currencies, the yen and the Swiss franc, the chart below for the cross rate highlights the extraordinary strength that the yen has at present. The 240-minute chart below especially illustrates the recent topping pattern of the Swiss currency and its inability to break above 83.
Similar concerns about central bank intervention would apply to trading this currency pair right now, but it would be tempting to make a short-term trade of selling CHF/JPY at the 81.40 level with a stop at 81.90 and a longer-term target at 80.40 (with scaling out of the position as an appropriate tactic).
Several individual stocks caught my attention from the TWF daily scanning routines and are worthy of consideration with the qualification which should always be made, that these are not specific recommendations for today’s session but rather indicative of broad patterns which may bear fruit in coming sessions.
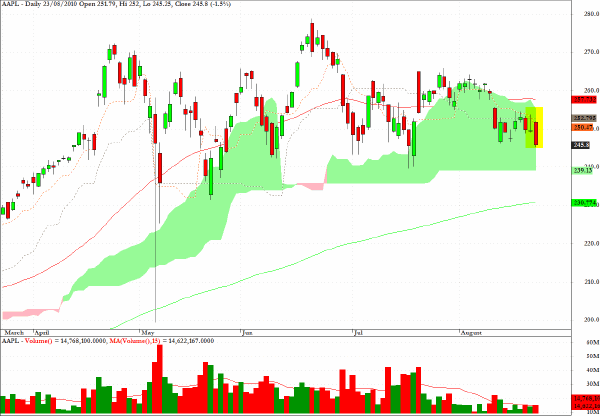
AAPL triggered an Ichimoku signal yesterday, which can be an early indicator of impending weakness, based upon the Tenkan Sen line crossing the Kijun Sen line from above. More details about this pattern are available to premium subscribers along with other useful clues provided by technical pattern analysis.
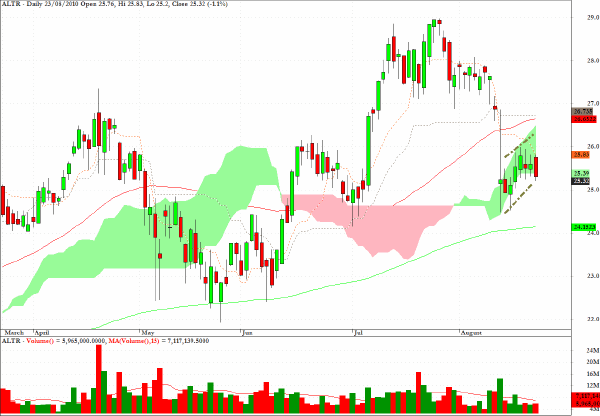
Altera has a clearly visible bear flag pattern which could be on the point of breaking down and the close dropped below the cloud formation.
AMCC also has a well defined bear flag pattern.
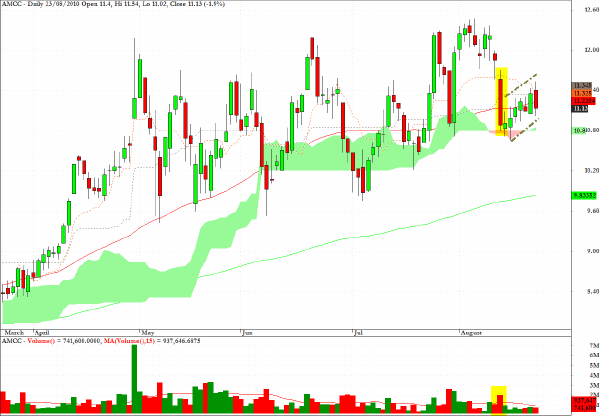
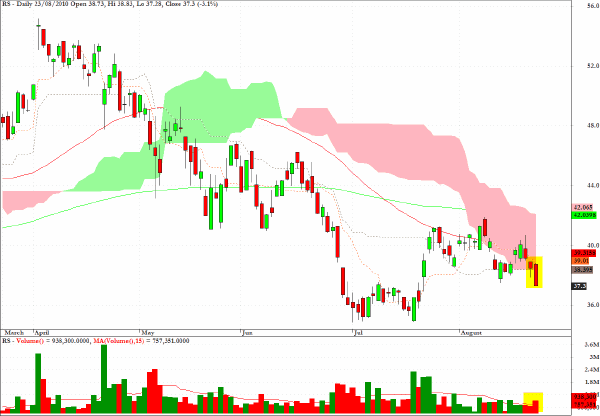
One of the patterns which I scan for pays attention to those stocks which have volume which is greater than 1.2 times the 15-day moving average of volume but less than 1.5 times the average volume. These stocks could be at an inflection point and getting ready to make a decisive directional move.
Reliance Steel (RS) fits the above description and also dropped below the cloud and looks ready to revisit the recent low.
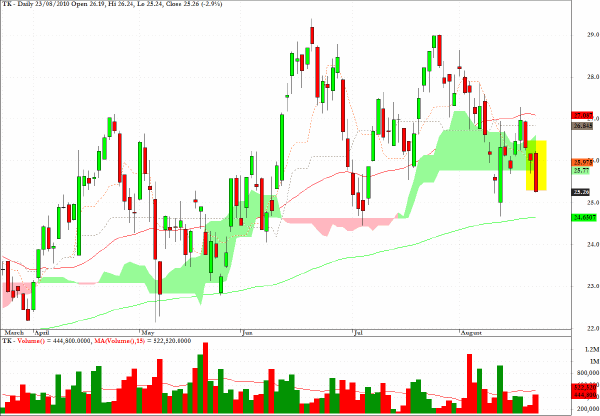
Teekay Shipping (TK) also fits the volume characteristics described in reference to RS and also dropped out of a cloud formation.
In this case with the 200-day EMA lying less than a dollar below yesterday’s close I would be inclined to wait for a rebound before looking on the intraday patterns for a suitable entry on the short side. If such an entry doesn’t present itself then be prepared to move on and look at other opportunities.
Clive Corcoran is the publisher of TradeWithForm.com, which provides daily analysis and commentary on the US stock market.
|