Good morning! For the first time in several weeks the market had a rather significant downside move. We still were not seeing much for intraday weakness heading into the day, however, and the morning action remained light and range bound for the most part. Coming out of 10:30 ET the indices began to move somewhat higher. They picked up steam out of the 12:00 ET reversal period when they broke a 5 minute base at highs. The oil and energy stocks really led the move.
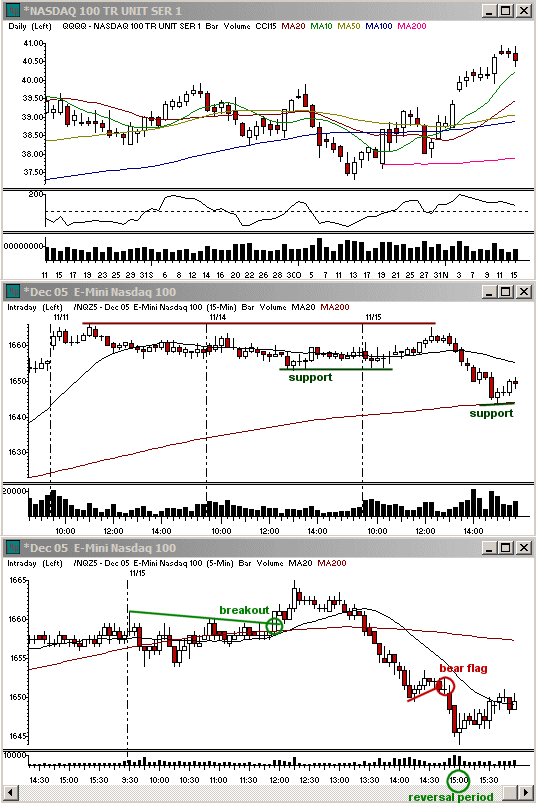
Thee market tried to base along highs once again for a 5 minute bull flag into 13:30 ET. Once the base was of comparable length as the prior one though, the 5 minute 20 sma support gave way, triggering a rather significant breakdown. This kicked off the sharp afternoon decline I was actually looking for on Monday. The selloff continued rapidly lower with very little for continuation patterns until the stronger Dow Jones Ind. Ave. was back at morning lows.

The market finally stalled and based along support for about 45 minutes ahead of the 15:00 ET reversal period. This was the only bear flag that the afternoon decline offered. Since it was so small compared to the prior drop, it did not lead to as significant of a continuation move, but it was enough to move the market to new intraday lows. Once the 15:00 ET reversal period hit, however, volume spiked to indicate exhaustion. This helped correct the market going into the close as it bounced off the 15 minute 200 sma zone that hit intraday on the NASDAQ and SP500.

I would have liked to have seen a bit better trap action for the bulls on the intraday charts than we had on Tuesday for a strong continuation of the decline. While the afternoon move was significant intraday, the rally last Thursday was still a great deal stronger. For swingtrades I am looking primarily on the short side at this time, but for daytrades I am still fairly unbiased. I will be more likely to treat longs as more scalpish though.
Economic Reports and Events
Nov. 16: Business Inventories for Sep (8:30 am), Core CPI for Oct. (8:30 am), CPI for Oct. (8:30 am), Net Foreign Purchases (9:00 am), Crude Inventories 11/11 (10:30 am)
Nov. 17: Building Permits fr Oct. (8:30 am), Housing Starts for Oct. (8:30 am), Initial Claims 11/12 (8:30 am), Capacity Utilization for Oct. (9:15 am), Industrial Production for Oct. (9:15 am), Philadelphia Fed for Nov. (12:00 pm)
Nov. 18: Leading Indicators for Oct. (10:00 am)
Nov. 21: -
Nov. 22: Existing Home Sales for Oct. (10:00 am), FOMC Minutes (2:00 pm)
Earnings Announcements of Interest
Only stocks with an average daily volume of 500K+ are listed. List may not be complete so be sure to always check your stocks' earnings dates before holding a position overnight. (A) = Earnings after the close, (B) = Earnings before the open, (?) = Earnings time not specified at the time of this writing
Nov. 16: AMAT (4:30 am ET), CHRS (?), DHI (B), GLBL (?), HP (B), HOTT (4:00 pm ET), INTU (A), JLG (?), MW (A), NTAP (A), PETM (A), TLB (?), TYC (B), UGI (?)
Nov. 17: ARO (4:01 pm ET), ADSK (A), BKS (B), BEAS (A), CLE (06:00 am ET), FL (A), GPS (?), HRB (A), HPQ (?), KLIC (B), LTD (?), LTXX (A), MRVL (A), MSCC (A), JWN (?), PSS (?), SBUX (A), PLCE (B), DIS (?), WSM (B)
Nov. 18: ANN (B), CPWM (?)
Nov. 21: CPB (?), CBRL (?)
Nov. 22: ABS (?), CWTR (A), DE (?), DG (B), DLTR (B), HRS (?), MIK (A), OPSW (A), PETC (?)
Toni Hansen is President and Co-founder of the Bastiat Group, Inc., and runs the popular Trading From Main Street. She can be reached at Toni@tradingfrommainstreet.com.


 Free Festival of Traders Videos