| Corcoran Technical Trading Patterns For September 1 |
| By Clive Corcoran |
Published
09/1/2010
|
Stocks
|
Unrated
|
|
|
|
Corcoran Technical Trading Patterns For September 1
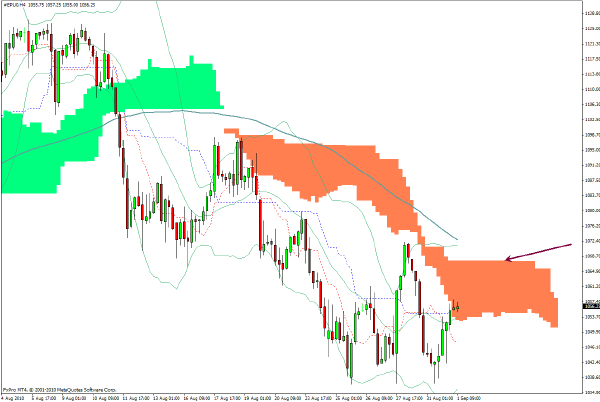
In early European trading the S&P 500 futures have managed to remain above the 1050 level after yesterday’s unsuccessful efforts to probe levels below 1040 discouraged the bears.
One would expect the action to remain somewhat muted this week but position squaring ahead of the NFP data on Friday - which is ahead of the long Labor Day weekend in the US - could produce some surprises.
I would be very surprised to see the 1068 level (indicated by the arrow) taken out before Friday and would be less surprised to see the index closer to the 1040 level as we approach Friday’s data.
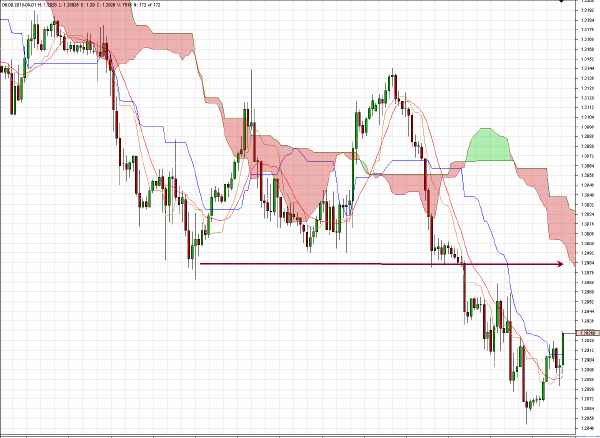
One consequence of the current preoccupation by many asset allocators for wanting to be in safe haven assets has been strong demand for the Swiss franc as opposed to the "riskier" euro currency. EUR/CHF in yesterday’s trading dropped precipitously to new historic lows and clearly the trend is downwards but sharp relief rallies can be expected as seems to be under way in European trading on Wednesday morning. One can either play for quick rallies but be prepared to be stopped out quickly when the downtrend resumes, or, perhaps more appropriately, wait for the pair to reach back to resistance levels (as visible on the 30 and 60-minute Ichimoku charts) and play the short side.
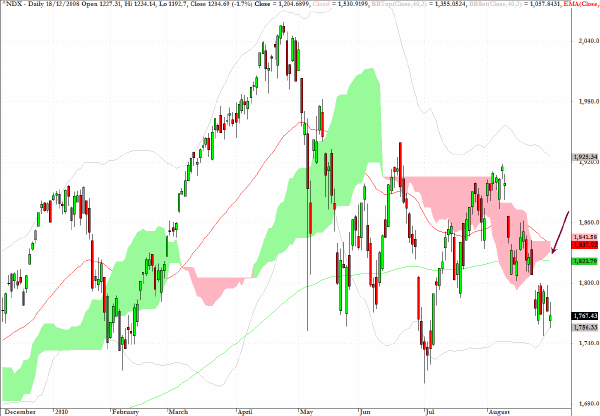
The last time that I discussed the Nasdaq 100, in mid-August, I proposed that the 1750 level seemed to be a viable downside target for testing and the index actually touched 1749 last week on August 27. The outlook for this index still remains one where under-performance of the broader market seems probable and as suggested by the arrow on the chart there is a growing possibility of an occurrence of the so called "death cross" (i.e. where the 50-day EMA crosses the 200-day EMA from above).
Also worth contemplating is an eventual retesting of the intraday low of 1700 from July 1.
Incidentally, on some of the charts below including that for NDX there is an incorrect date showing in the top left hand corner, but the charts themselves were captured following yesterday’s closes.
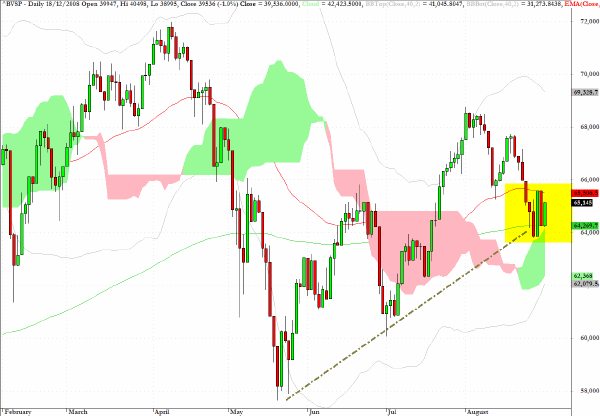
The Bovespa index in Brazil is making a valiant effort to stay above the trendline and the cloud formation and as suggested here recently for those favoring the long side in global equities at present the EWZ fund, which tracks the MSCI Brazil index, would be one of the preferred candidates on the long side for the intermediate term.
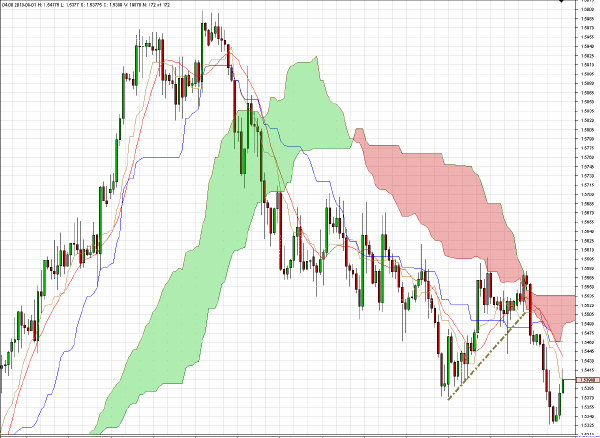
The 240-minute chart below for GBP/USD shows a clear downtrend following sterling’s failure at the $1.60 level in early August. I would expect a rally back towards $1.5540 at which point I would be looking for entry points on the short side.
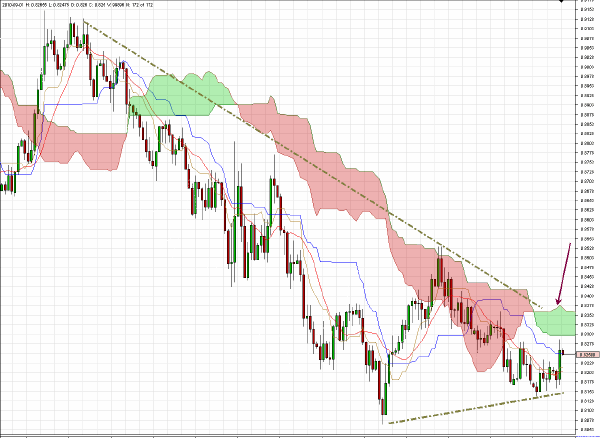
After failing to make much progress following its break below the .82 level, EUR/GBP re-tested the 0.8280 level yesterday (as I suggested it would from my Twitter account) and has now consolidated in a possible flag formation before attempting to break through the cloud formation. The higher lows annotated suggest that if the 0.8380 level could be penetrated there could be a faster move to the upside for the euro against sterling.
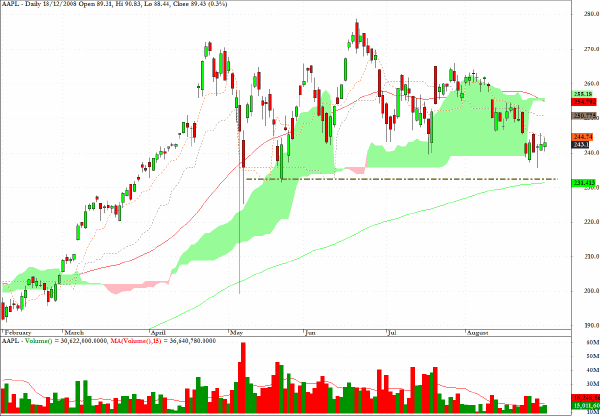
On August 24 I made the following comment about the chart for Apple.
AAPL triggered an Ichimoku signal yesterday, which can be an early indicator of impending weakness, based upon the Tenkan Sen line crossing the Kijun Sen line from above. More details about this pattern are available to premium subscribers along with other useful clues provided by technical pattern analysis.
The stock has been drifting sideways with a slight bias to the downside and, as is apparent from the daily chart, the $230 is a critical support level for this stock.
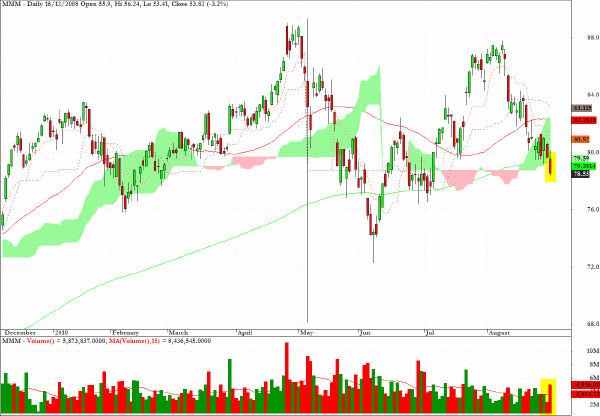
The chart for 3M caught my attention as it displays a break below the 200-day EMA as well as fall from the overhead cloud formation on above average volume. Also from a longer term perspective the lower high seen in early August, in comparison to that seen in April, registers more technical weakness for this Dow component.
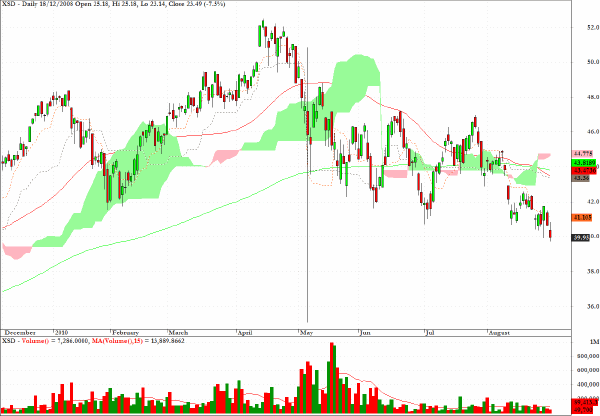
The semiconductor stocks have continued to under-perform as suggested here during the last few weeks and the exchange traded fund XSD is failing to find buying interest as it slides towards a possible $36 target level which was touched in trading on May 6th and revealed as the large spike down on the chart below.
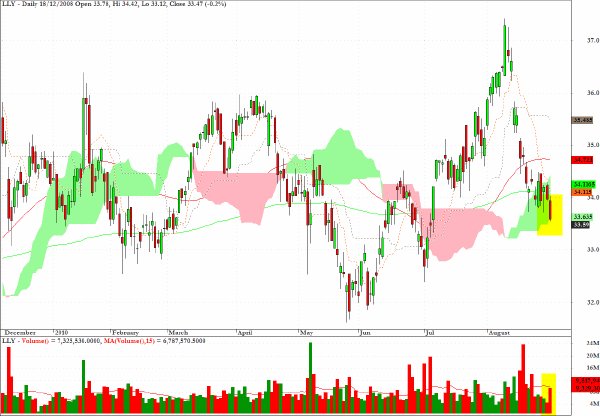
The chart for Eli Lilly (LLY) shows technical weakness and yesterday’s drop from the cloud on twice the average daily volume also penetrated an uptrend line (not shown) through recent lows.
Clive Corcoran is the publisher of TradeWithForm.com, which provides daily analysis and commentary on the US stock market.
|