| Corcoran Technical Trading Patterns For September 2 |
| By Clive Corcoran |
Published
09/2/2010
|
Stocks
|
Unrated
|
|
|
|
Corcoran Technical Trading Patterns For September 2
In yesterday’s commentary I noted that there could be surprises ahead this week with the turn of the month, the NFP data tomorrow and the long weekend in the US. I did not expect to be quite so surprised by the rally in global equities which saw the S&P 500 move up to 1080 and some rather sharp moves up from indices such as the Russell 2000 and the CAC40 in Paris which moved up by 3.5%.
The dire performance of many sectors in August had created a complacency among those short many sectors of risk on assets and overly long on risk off assets such as Treasuries, and it did not take too much of a squeeze to see a scramble which caused large price movements albeit on fairly anemic volume.
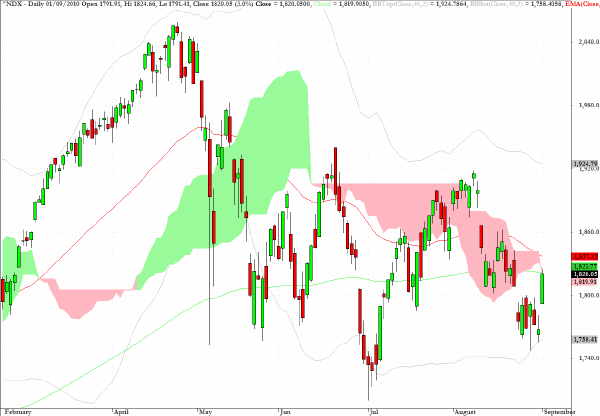
The Nasdaq 100 closed very near to the point where the 200-day EMA and the cloud formation intersect at 1826.
The big question of course is how sustainable was yesterday’s rally? The low volume suggests that the major dynamics at work yesterday were short covering but the almost uninterrupted move up in August for government bonds does provide a backdrop of pessimism and bearishness which will be ripe for sudden and sharp upward movements in risk assets as the bulls take advantage of the relative illiquidity which could continue until mid-September.
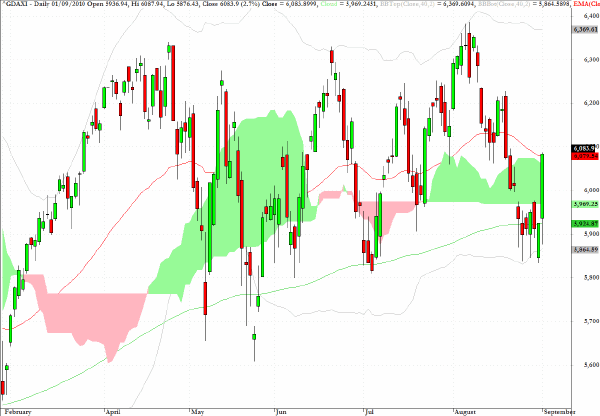
The DAX index in Germany reveals a very well defined trading channel since mid April and the real test for the bulls on this index will be confronted around the 6400 level which, following yesterday’s piercing of the cloud formation, seems likely to be tested in coming sessions.
Reviewing many charts for equity indices this morning, there is a common theme that I shall be discussing later today in a slot on CNBC’s European Closing Bell. Despite a lot of poor economic data and an unusually strong rally in government bonds (except for the PIIGS nations) there is clear evidence that the primary trend over the last few months is sideways.
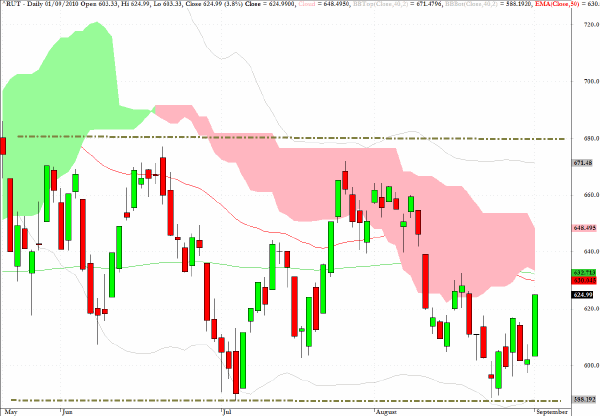
The chart below for the Russell 2000 demonstrates the characteristics of this trading range phenomenon well.
Since the May 6 mini crash the index has been confined within a 100 point range with 680 on the top and approximately 580 on the bottom. My expectation is that, having recently tested the lower boundary of the range one should, using probabilistic assumptions, be anticipating a move back towards the 680 level. However, a sideways range can always be broken by a major surprise event such as renewed concerns about Club Med. My current thinking is that bad news about US employment data is unlikely to be a candidate for the "major surprise" category.
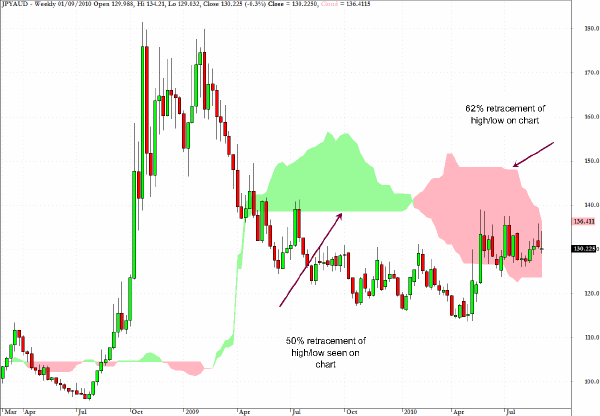
Another chart which I hope to discuss on CNBC Europe today is the unorthodox view of the yen/Aussie dollar with the Japanese currency as the base currency.
The comments on the chart will be discussed in more detail but the general theme is that for those advocating a bullish case for risk on assets a lot rides on the ability of the Australian currency to be able to move above the 138 level which is the 50% retracement from the high/low seen on the chart.
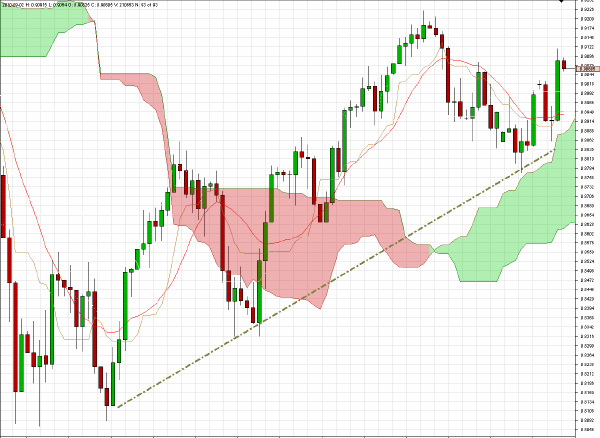
The case made above regarding the Aussie/yen cross rate is also revealed on the AUD/USD chart below. During the last few sessions in August the Australian dollar came close to violating the trend line drawn and also breaking into the cloud formation. In recent sessions, and helping to lay the groundwork for yesterday’s rally in equities, the renewed energy has kept the currency above the correction zone.
If AUD/USD can close above 9220 then the rally in risk assets could be more than just a late summer/thin market surprise.
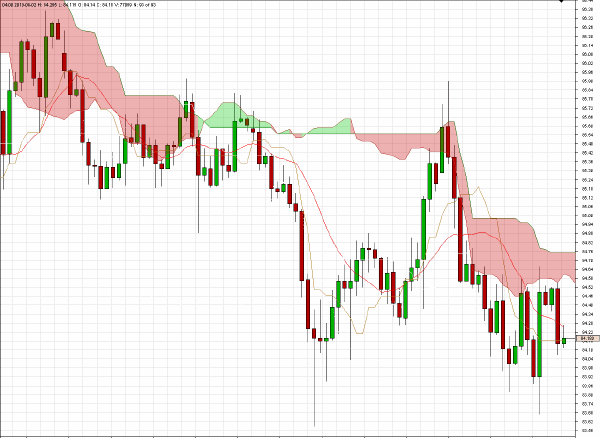
USDJPY may yet again prove to be the canary in the coal mine as illustrated on the 240 minute chart below, where all recent efforts for the US dollar to break above the descending cloud pattern have failed.
The reaction of the pair to the NFP data tomorrow will, as always, be critical in assessing the tone for not only US equities but more critically the near term direction of the Nikkei 225.
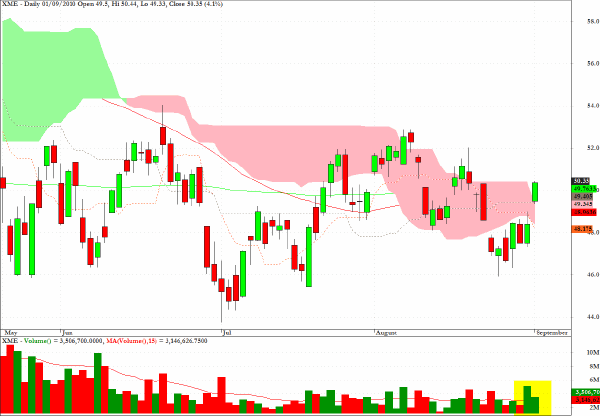
The chart for XME below also reveals the trading range theme mentioned previously and the rather feeble volume which managed to move price up by more than 4%. However if the markets are going to remain in a sideways mode, the path would appear now to be a test of the $54 level.
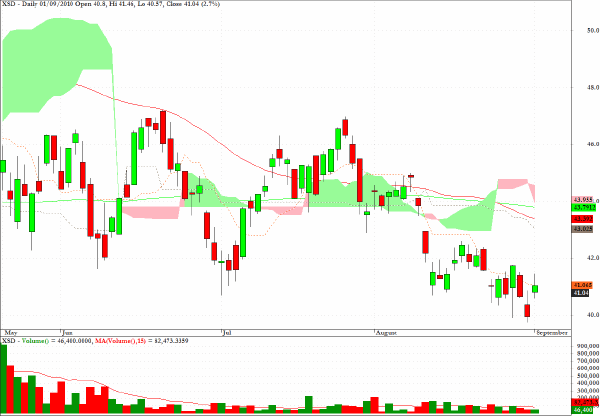
The chart for XSD underlines the concern already expressed that a lot of sharp upward price movements yesterday were the result of very light volume.
Clive Corcoran is the publisher of TradeWithForm.com, which provides daily analysis and commentary on the US stock market.
|