NASDAQ Commentary
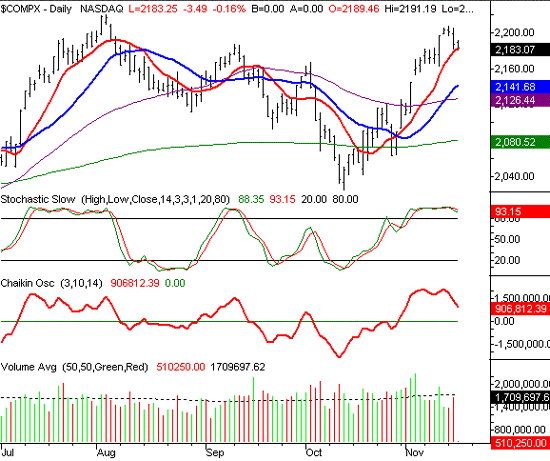
After a few weeks of respectable gains, the weight of those gains is becoming evident. The NASDAQ Composite gave up 14 points yesterday in the biggest one-day slide we've seen since early October. And today, they buyers aren't exactly pouncing on the values created by the drop. In fact, we've already seen a lower low today, so the bulls don't have a lot to be enthusiastic about......at least not in the short run.
Overall, we'd say this change of tone is pretty typical. The index rallied well for a few weeks, stalled between 2150 and 2180 for a couple of days, then the bulls made one last effort last week, pushing the NASDAQ up to 2206.88. But with buying volume already drying up by that time, we knew a little selling pressure was just around the corner. So in the bigger picture, this dip isn't really anything to get overly excited about.
The key here is now the 10 day moving average (red). The composite pulled away from it (and all the moving averages) several days ago, and hasn't touched it again until today. The problem for the bulls is that the index looks pretty comfortable under that mark. The 10 day line is at 2182.42, while the index is currently at 2181.76....and its been under the 10 day line for most of the day. Technically, we need to see two consecutive closes under the 10 day line - the second lower than the first - to lock in that bearish signal. We don't even really have the first one yet, as the day isn't over yet. The earliest we could possibly see that complete signal is 4 pm EST tomorrow, so there's still a glimmer of hope for the bulls.
That said, although it looks like that's the direction things are headed, the truth is that we have nothing in the way of full-blown sell signals. The Chaikin line is falling, but is still above zero. The stochastic lines are on overbought territory, but have yet to fall under 80. The MACD liens are rolling over (not shown), but we don't have a bearish cross yet. Point is, although we'd be very hesitant to get bullish here, we're not yet getting fully bearish either.
NASDAQ Chart

S&P 500 Commentary
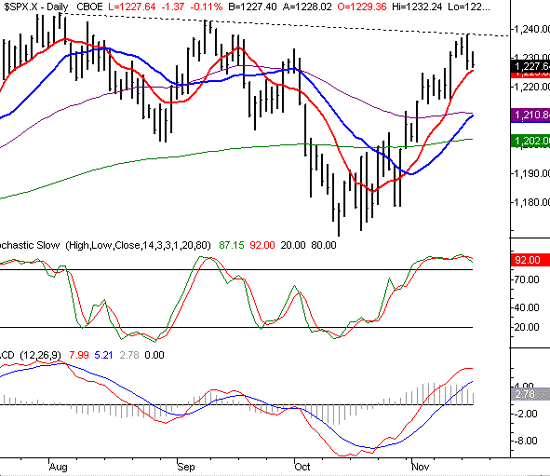
In the Weekly Market Outlook, we highlighted the concern that the S&P 500 was parked right under a major resistance line (dashed) that could be the undoing of the current uptrend. That line was given one more test on Tuesday, with the high of 1237.94. A few hours later, it became clear that the line was indeed a resistance point, as the SPX closed at 1229, losing a little more than 4 points for the day. Today's recovery effort (so far anyway) has been mixed, and we now find the SPX trapped between a rock and a hard place.
The "rock" is that resistance line, again plotted on our chart below. The 'hard place' is the 10 day moving average, in red. Even after yesterday's loss, we've yet to actually touch it. However, like the NASDAQ, we think this is going to be the front line of the battle between the bulls and the bears. The 10 day line, currently at 1226, is just 2 points under the SPX's level, so we should soon have a pretty good idea of which side of things the market things are going to end up on. Based on what we see right now, we remain mixed. But like the NASDAQ's chart, there are an awful lot of indicators that are on the verge of turning bearish. The fact that this is happening right after the S&P 500 hit a resistance line makes us even that much more concerned, in the short run anyway.
On the bigger picture, we remain bullish. So even though the dip could be big, it would be a buying opportunity. The worst case scenario is probably a fall all the way to 1210. That's where the 20 and 50 day lines are both resting right now. That 25 point slide would only be a 2 percent slide, which is nothing unusual for the back-and-forth environment we've been stock in all year.
If by some chance the 10 day average ends up holding as support, we still have that resistance line. Any bullishness should be put on hold until we see the SPX close above that mark.
S&P 500 Chart

Dow Jones Industrials Commentary
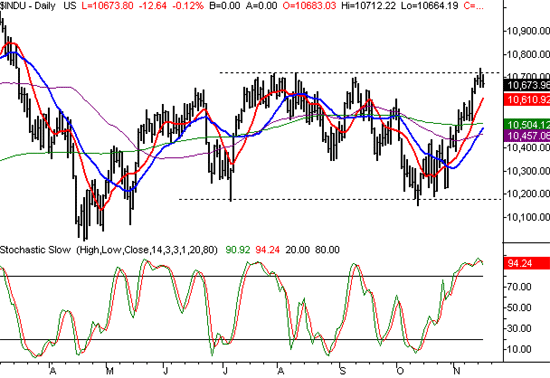
There's not a lot to add here for the Dow's chart. We mentioned last week that the horizontal resistance at 10,720 was still a factor, and given that the current selling started after the Dow hit a high of 10,742, we'd still have to say its a resistance area. And with the Dow currently at 10,673, we'd also have to say that the resistance line won the first battle.
In terms of bullish divergence, the Dow actually did the best job at pulling away from all of its moving averages. In fact, it's still the furthest away from the 10 day average (currently at 10,611), so in many respects, the Dow is the most vulnerable index right now. And it should be no surprise to hear is say that we think that vulnerability will be exploited. The chart is just too overbought, and yesterday's selling volume was just a little too strong, to think that the index could just zip right past 10,720. The first checkpoint for such a fall is indeed the 10 day line, but also note the 200 day line at 10,504 as a possible landing spot.
After that, we think the usual year-end strength will kick in again, so if we get enough evidence of a bounce at that time, you may wish to go long between the 10,500/10,600 area. But until the Dow breaks cleanly past 10,720, we're not going take on any major bullish stances. That said, if the Dow breaks above 10,720 without having closed under the 10 day line, then don't fight the obvious. Odds are that will be a sign that the bulls are ignoring the overbought situation, and looking for a rally. Take that breakout at face value, especially in the most bullish period of the year.
Dow Jones Industrials Chart

Price Headley is the founder and chief analyst of BigTrends.com.