| Corcoran Technical Trading Patterns For September 3 |
| By Clive Corcoran |
Published
09/3/2010
|
Stocks
|
Unrated
|
|
|
|
Corcoran Technical Trading Patterns For September 3
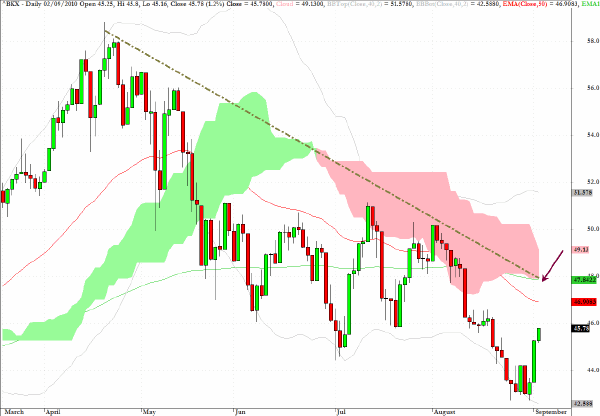
Friday morning's trading in Europe remains subdued as market participants await the release of the US Labor Department's employment related data at 08:30 Eastern time. The S&P 500 futures have made a little progress since yesterday's New York close and are currently at 1090 which places them in a price congestion zone between 1090 and 1095. It would appear that the current thinking is that a weak report will give cover to Bernanke for a second round of QE and that this will be "good" for equities. Rather than take a view on that kind of theorizing I would rather wait and see how markets actually react to the number today and will be watching several key instruments today. In no particular order they are spot gold, USDJPY, yields on longer term Treasuries and the financials. The KBW Banking Index (BKX) has bounced after reaching below the February low and I have indicated on the chart where this index should face a real challenge which corresponds to the point where the downtrend line and the 200 day EMA coincide at approximately $48.
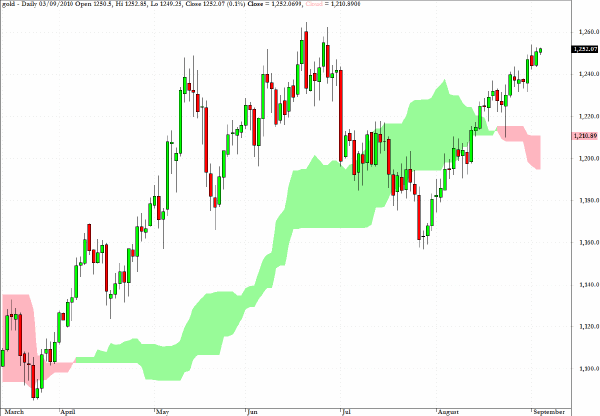
Spot Gold is quite critically poised as we head into today's data. We could see a sharp move up through previous highs if the promise of QE2 is not yet fully discounted in current market sentiment or if we were to see a sell off this could raise questions about a failure and lower double top pattern. Readers may recall that last October I suggested $1350 as a technical target based on the break through an inverse head and shoulders pattern and that target still stands in the longer term. But in reviewing the current technical patterns my concern would be that a setback today could lead to some aggressive selling by some trading desks.
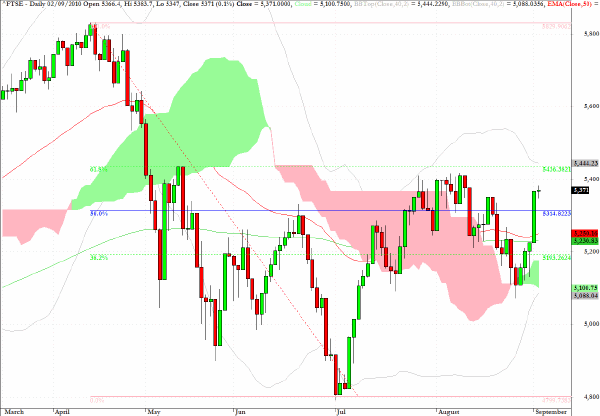
The FTSE index provides further evidence of the range bound/sideways action which was discussed here yesterday. Reviewing the fibonacci grid on the chart the 5436 level, which also coincides with the bounce level following the sharp move down in early May, appears to be in need of testing in coming sessions.
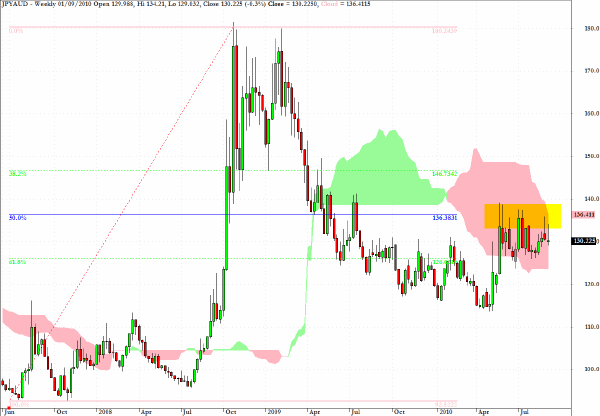
In yesterday's commentary I discussed the chart for JPY/AUD, which I also presented on CNBC's European Closing Bell, and kept the chart deliberately simple for broadcast purposes. I thought it would be helpful to show the full fibonacci grid and to re-state the reason why the unorthodox view of this cross rate, where the yen is being used as the base currency as opposed to the more conventional quotation with the Aussie as the base currency, can provide a useful perspective on the risk appetite orientation. The simple idea is that moving up the vertical axis (i.e. increasing strength of the yen) equates to diminished appetite for risk and moving down the axis suggests a growing appetite for risk assets - especially emerging markets and commodities. The key ratios on the chart show that the Aussie dollar has reached a fairly key level following the earlier 2010 strength and that in reaching back towards the 50% retracement level on the chart but managing to stay below that level the prevailing market tone remains somewhat neutral with respect to the risk on/risk off dichotomy. A more supportive environment for risk assets would be assisted by a drop below the pink cloud formation on the right hand side of the chart and using the more conventional AUD/JPY quotation method this is in the vicinity of 81.
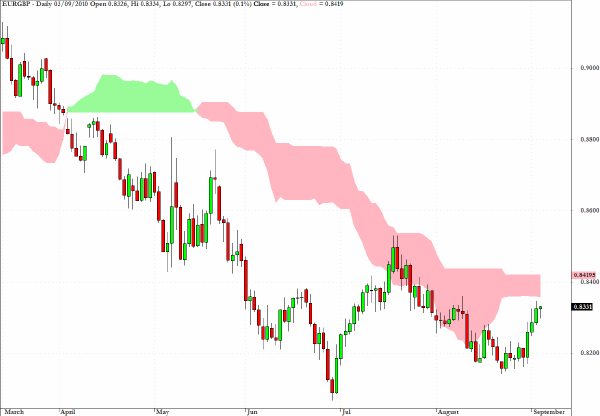
I am planning to look for pullbacks to increase long exposure on EUR/GBP with an initial target of .8380.
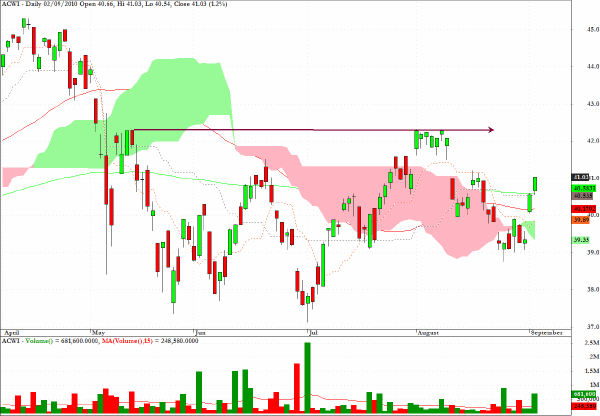
ACWI, the MSCI World Index, appears to be setting up for another attempt to test the bounce level following the May 6th plunge which is indicated by the arrow on the chart
Clive Corcoran is the publisher of TradeWithForm.com, which provides daily analysis and commentary on the US stock market.
|