| Corcoran Technical Trading Patterns For September 7 |
| By Clive Corcoran |
Published
09/7/2010
|
Stocks
|
Unrated
|
|
|
|
Corcoran Technical Trading Patterns For September 7
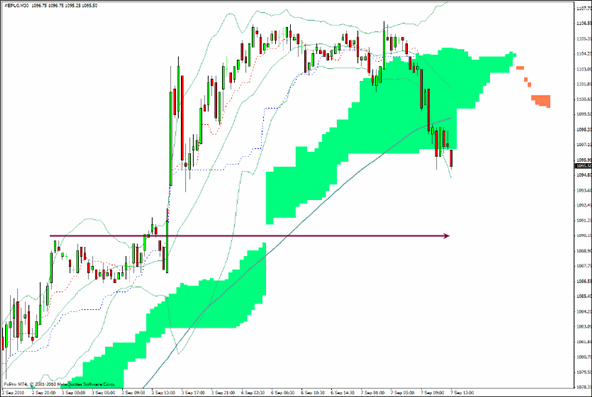
The S&P 500 futures have been acting poorly during European trading on Tuesday morning. The 30-minute chart below suggests that a re-visit to the 1090 level may be on today’s agenda when trading resumes in the US following the extended weekend.
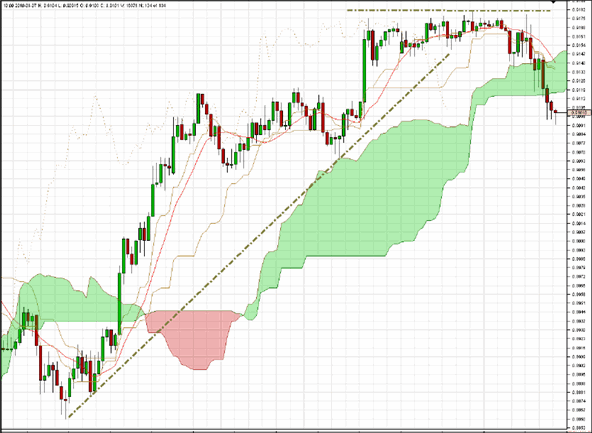
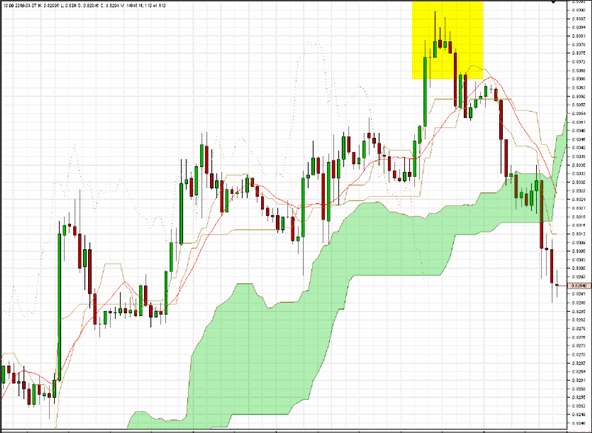
AUD/USD has taken a hit on Tuesday after a surprise move (or absence of move) by the RBA on short-term rates.
The hourly chart clearly reveals the plateau pattern following the break of the trend line and the manner in which traders were waiting to see what the central bank would do.
The next major line of support is around the .90 level against the US dollar.
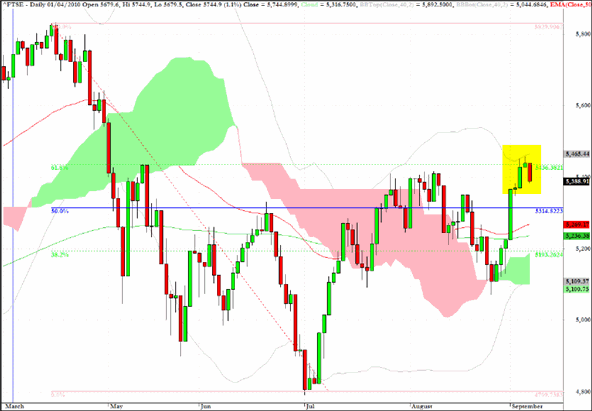
I'll repeat my comment from last Friday’s letter regarding the UK’s benchmark index.
Reviewing the fibonacci grid on the chart the 5436 level, which also coincides with the bounce level following the sharp move down in early May, appears to be in need of testing in coming sessions.
Having tested the level and closed almost exactly on it in Monday’s session, the index is retreating and adding further validation to the notion that, until proven otherwise, this market in harmony with many others is in a fairly easily discernible trading range.
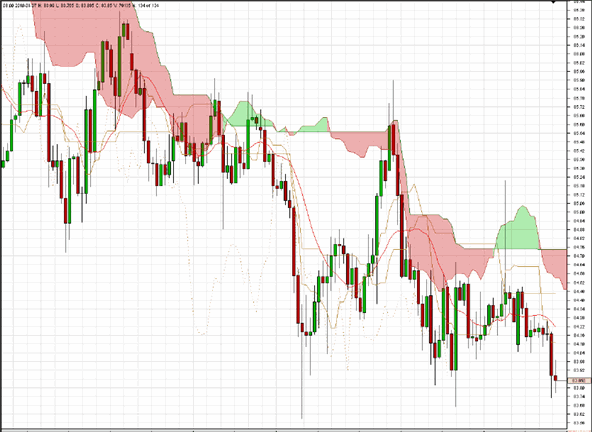
The Japanese currency is approaching the recent lows below 84 and attention should be focused today on whether there is triple bottom bounce or more ominously the 83.60 level fails to hold. As always central bank intervention remains a possibility and this will keep me very cautiously confined to playing short term scalping moves at most.
Here also is another comment from Friday’s column.
I am planning to look for pullbacks to increase long exposure on EUR/GBP with an initial target of .8380.
I exited the entire position and am now neutral on this cross rate.
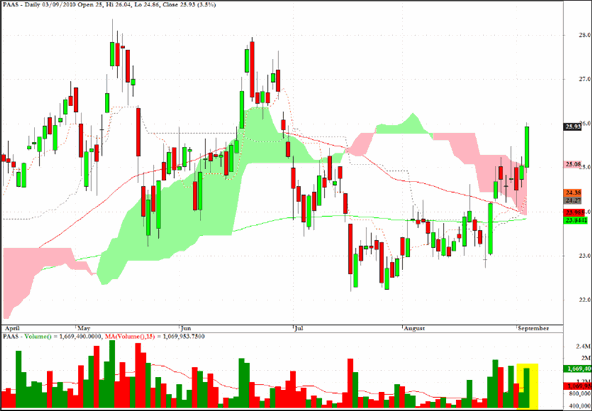
Pan American Silver (PAAS) managed to break through key levels on strong volume last Friday, and one would expect in coming sessions, not necessarily today, to see followthrough towards the recent top of the range.
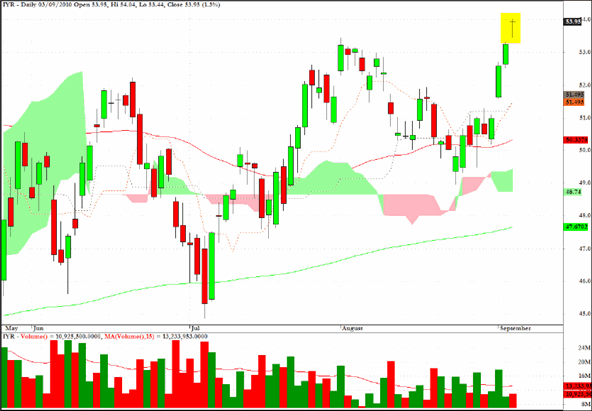
IYR, a sector fund which tracks US real estate, registered a tiny doji star/hanging man candlestick from last Friday which could equate to a short-term exhaustion top.
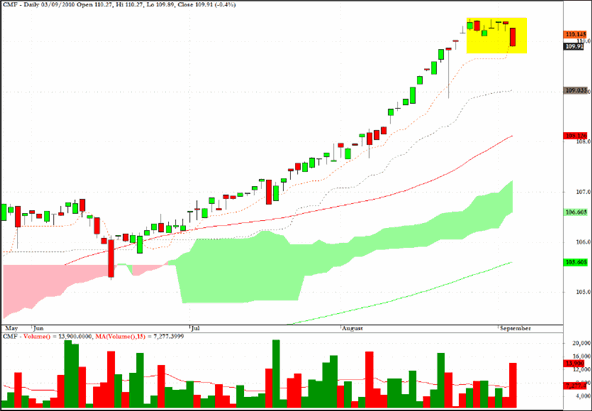
CMF, the exchange traded fund which tracks California’s municipal debt, appears to be entering a correction after Friday’s red trend day on substantial volume.
Clive Corcoran is the publisher of TradeWithForm.com, which provides daily analysis and commentary on the US stock market.
|