| Corcoran Technical Trading Patterns For September 13 |
| By Clive Corcoran |
Published
09/13/2010
|
Stocks
|
Unrated
|
|
|
|
Corcoran Technical Trading Patterns For September 13
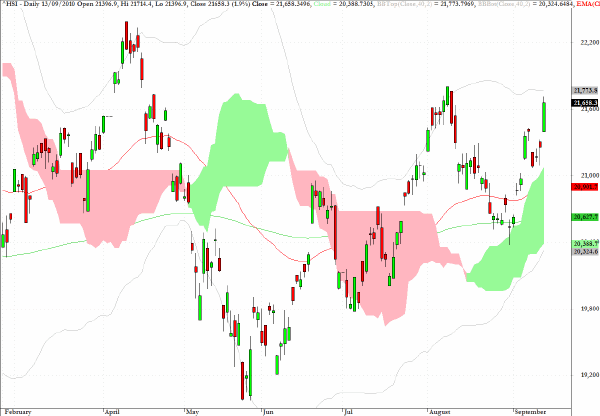
Asian markets rallied in Monday’s session with the Hang Seng Index registering a gain of almost 2% and the Mumbai exchange surpassing that, at the time of writing, with a 2.2% gain.
The daily chart below for the Hong Kong market shows that today’s close is approaching the top of the recent range and this raises the question as to whether the range-bound condition of most global equity markets will persist or whether there is a possibility that a new-found enthusiasm for risk assets might propel us above the ranges which have been in effect since the early part of the summer. Tomorrow’s action in Asia, as always much influenced by what happens later in today's North American session, will help to throw more light on the matter.
I'll be presenting a two-day TA workshop in London on Tuesday and Wednesday and will not be publishing again this week until Thursday.
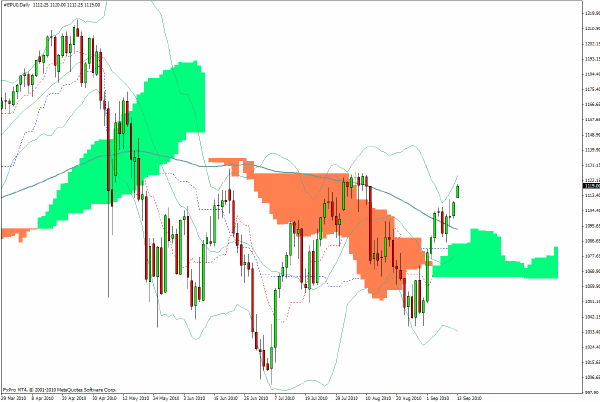
The S&P 500 futures have traded as high as 1121.50 during the European session which puts the 1130 target less than ten points away and suggests that this will be a target for automated trading strategies in coming sessions.
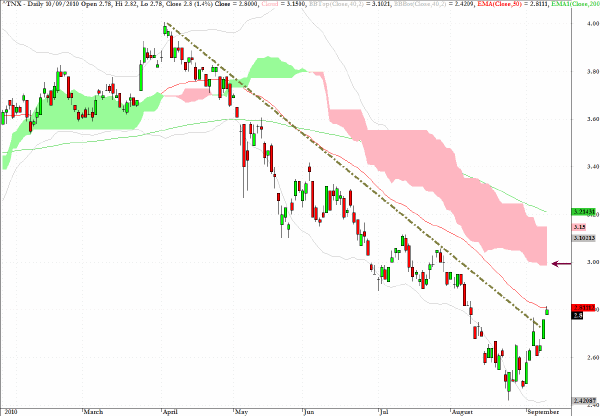
As the more adventurous posture towards risk assets begins to take hold, there is a possibility that yields on the 10-year US Treasury note will head back to the base of the cloud at the 3% level.
As the trend line drawn on the daily chart below suggests the steep drop in yields in August created a market which was ripe for correction, but owing to the proximity of the 50-day EMA one could also contemplate that there may be a consolidation near to current levels rather than a direct move up to a test of the 3% level.
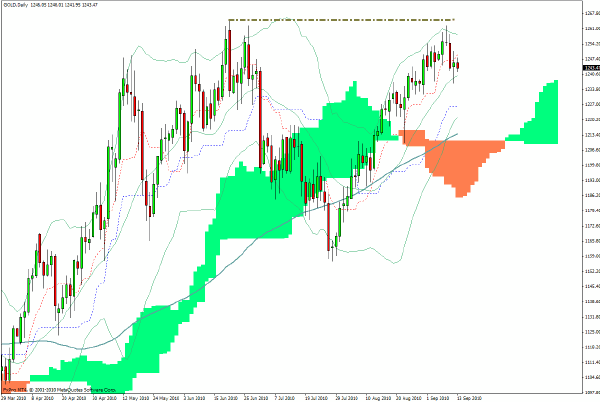
Some large funds have a lot at stake in the precious metals market and the daily chart for spot gold suggests that there must be concerns that a double top pattern (in the intermediate term) is in the process of being registered.
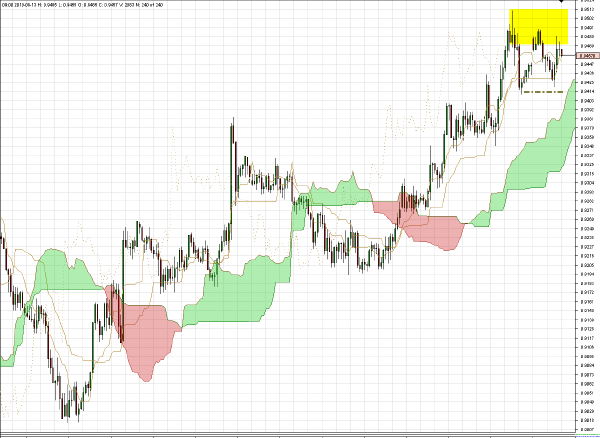
AUD/CHF would provide an intraday sell signal for me in today’s session on a break below 0.9410.
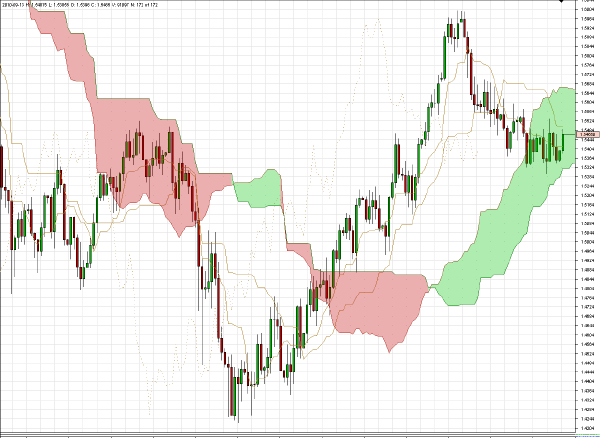
The daily chart below for GBP/USD shows that sterling is firmly within the cloud formation and likely to behave somewhat erratically. The key level which needs to hold is $1.5320 and if that should be broken then targets around $1.5150 would be activated.
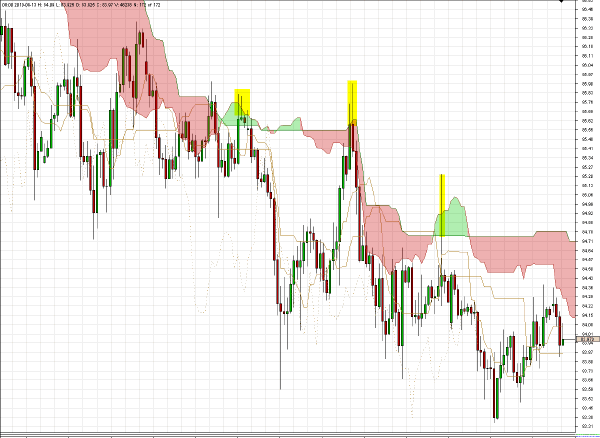
The comment that I made about USD/JPY on Septmber 2 continues to apply.
USDJPY may yet again prove to be the canary in the coal mine as illustrated on the 240-minute chart below, where all recent efforts for the US dollar to break above the descending cloud pattern have failed.
With both USD/JPY and USD/CHF still under pressure this morning, the FX markets do not appear yet to be embracing the notion that risk on is the way forward. Having said that, there were some profitable trades to be had at the end of last week by being long various yen crosses such as EUR/JPY and AUD/JPY as the yen saw some quick drops and I will be looking again at these short-term scalping opportunities this week as well.
If the dollar were to decisively break above 84.50 against the yen in today’s session, equity bulls would probably be sufficiently energized to have a run at moving the S&P 500 above 1130.
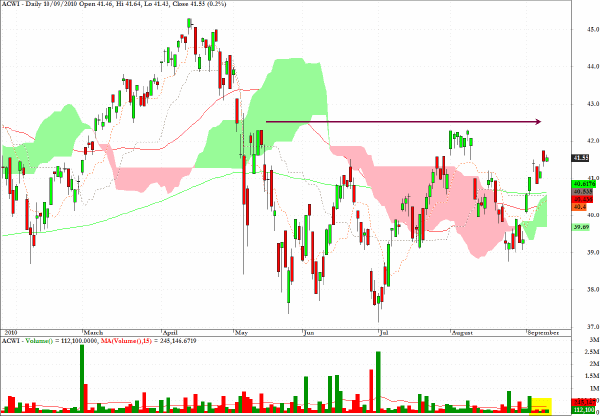
ACWI, the exchange traded proxy for the MSCI World Index, is close to reaching the target I have discussed here recently and will once again provide an important signal when touched as to the likelihood of the range bound conditions for global equities sustaining or entering a more expansionary phase.
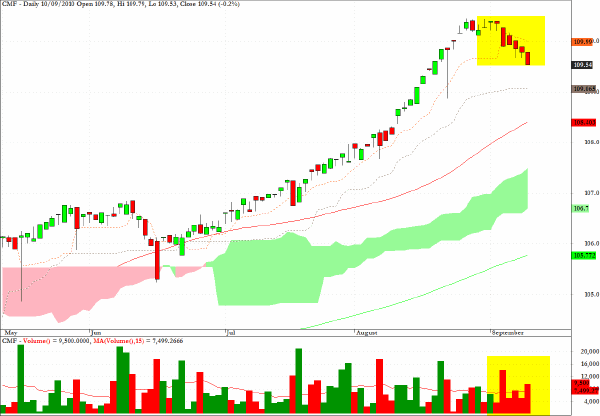
CMF, the exchange traded fund which tracks California’s municipal debt, has continued to correct, the likelihood of which was suggested here last week.
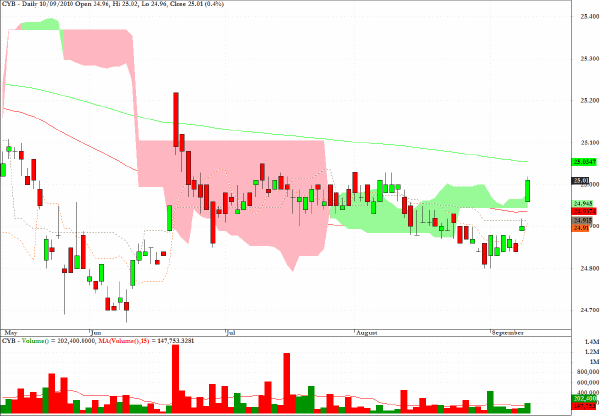
The stated objectives of the sector fund, CYB, are "to achieve total returns reflective of both money market rates in China available to foreign investors and changes in value of the Chinese Yuan relative to the U.S. dollar."
Recent stirrings in the Chinese currency, partly reflected in the chart below, suggest that this ETF is a vehicle to consider if there is follow-through in daily range expansion.
Clive Corcoran is the publisher of TradeWithForm.com, which provides daily analysis and commentary on the US stock market.
|