| Corcoran Technical Trading Patterns For September 20 |
| By Clive Corcoran |
Published
09/20/2010
|
Stocks
|
Unrated
|
|
|
|
Corcoran Technical Trading Patterns For September 20
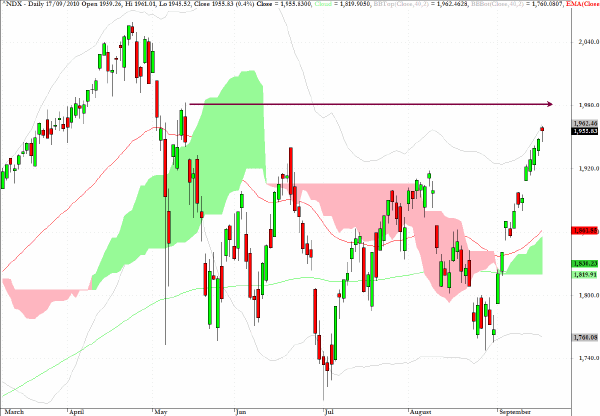
Last week I suggested that QQQQ could struggle around the $49 level and the chart below for the Nasdaq 100 index which QQQQ, the exchange traded proxy, tracks also indicates that the 1980 level is an area, coinciding with the recovery bounce from the early May spike down.
The hanging man candlestick from Friday’s trading is commonly seen at inflection points and could be a precursor to a temporary pause in the almost uninterrupted ascent seen during September.
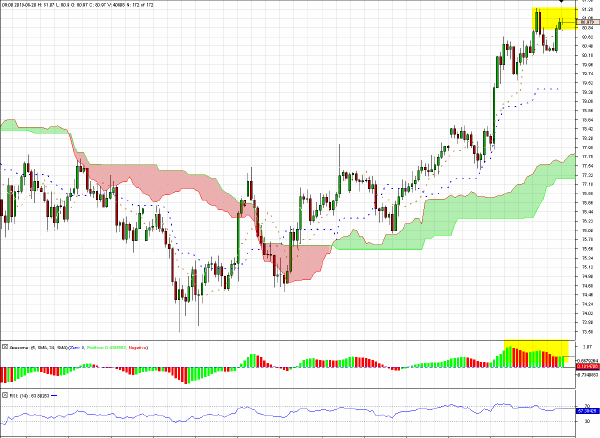
I have included a couple of indicators which I use for FX trading in conjunction with the 240-minute chart for AUD/JPY and the suggestion, still to be validated by price action later today, is that the Aussie dollar could be topping out against both the yen and the US dollar near to current levels.
Trading in Asia was relatively quiet on Monday with Japan closed for a public holiday and other markets performing rather unremarkably.
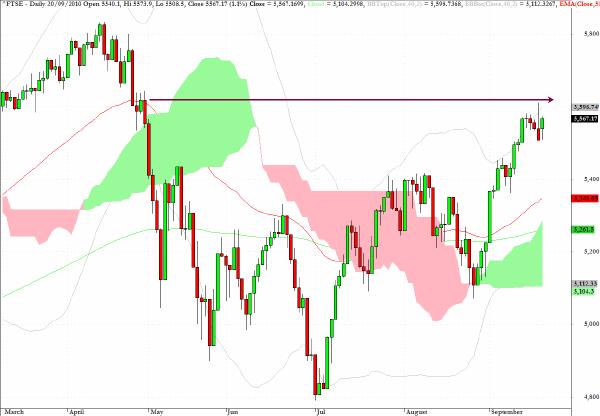
The main European markets are showing gains of about one percent at the time of writing but at present the FTSE is revealing an "inside" session with respect to Friday’s activity. A failure to close above 5600 in the next couple of sessions would suggest that the rejection encountered at Friday’s intraday high above this level could lead to some consolidation between 5400 and current levels.
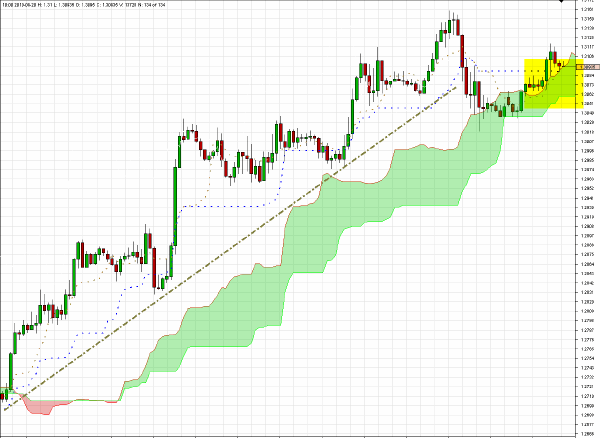
On the 60-minute chart for EUR/USD there is evidence of a broken uptrend line and the bias, I suspect, is to the downside during today’s session.
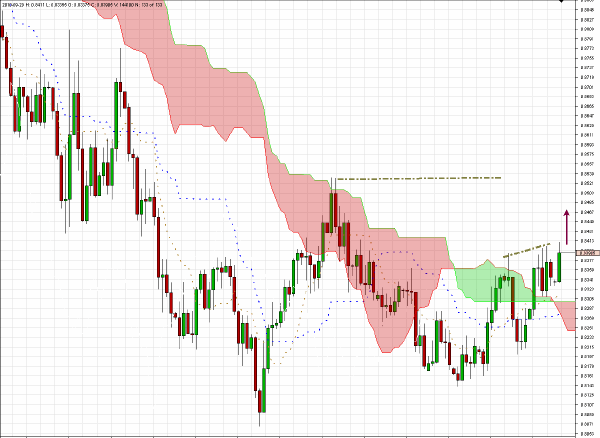
Last Thursday I made the comment that "the daily chart for EUR/GBP is suggesting that an intermediate-term target of 0.8530 is now feasible." During trading this morning in Europe the euro broke to a new recent high against sterling as shown on the daily chart below, and, although it encountered some substantial selling around the 0.84 level, the longer-term outlook is still pointing to further gains for the euro against the British pound.
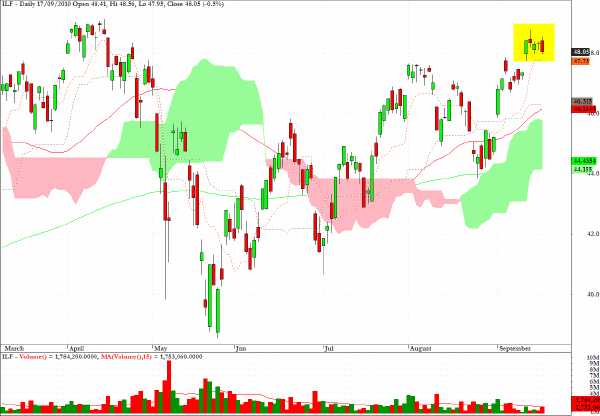
ILF is displaying a sequential candlestick pattern which suggests that there is firm resistance at the levels seen in April.
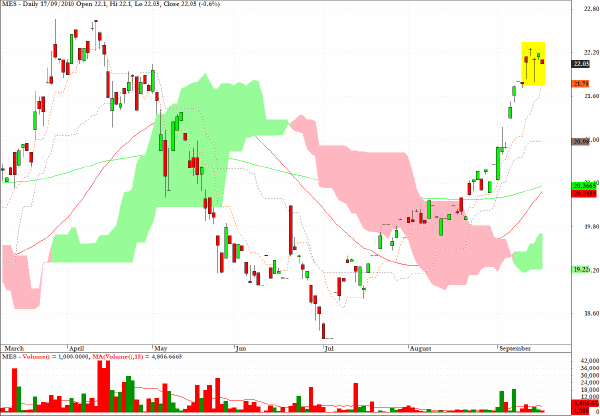
MES,an ETF providing exposure to the Gulf States region, has a similar appearance to that observed for ILF.
Clive Corcoran is the publisher of TradeWithForm.com, which provides daily analysis and commentary on the US stock market.
|