| The Wagner Daily ETF Report For September 20 |
| By Deron Wagner |
Published
09/20/2010
|
Stocks
|
Unrated
|
|
|
|
The Wagner Daily ETF Report For September 20
Stocks gapped up sharply on options expiration day, but were met with immediate selling pressure. Overall, trading was mixed on the day. All but one of the major indices saw the intraday high within 20 minutes of the opening bell. The small-cap Russell 2000 was the sole holdout, as it briefly found a new high at the 2:30 pm reversal period. Despite the abrupt opening reversal, the markets maintained a tight trading range throughout the session and all closed up for the day. However, there was divergence among the indices. The Nasdaq and the small-cap Russell 2000 led the way with each posting a 0.5% increase. The S&P MidCap 400 realized a 0.3% advance, while both the S&P 500 and the Dow Jones Industrial Average managed meager 0.1% gains on the day. Further, the three leaders closed near their highs of the day. In contrast, the Dow closed in the middle of its range, while the S&P 500 closed below the fifty percent mark.
As is often the case, options expiration brought a significant spike in volume on both the NYSE and Nasdaq. NYSE volume spiked 72% while the Nasdaq saw a 36% surge. On both exchanges, volume was well above 50-day average levels. Market internals were mixed, with declining volume exceeding advancing volume by 1.3 to 1 on the NYSE. Nasdaq advance/decline volume ratio was slightly positive at 1.2 to 1.
The Ultra Short Yen Proshares (YCS) is showing distinct signs of what may be a trend reversal. YCS has been in a major downtrend since May of this year. But, last Wednesday, this ETF gapped up almost 6.0% on an explosion of volume. It is now consolidating at the breakout and just below the 50-day moving average. Further, the downtrend line drawn through the May 5 and September 3 highs has been breached. A break above the 50-day moving average or a pullback into the 20-day exponential moving average provide potential "buy" entry signals. We are monitoring for a potential entry.

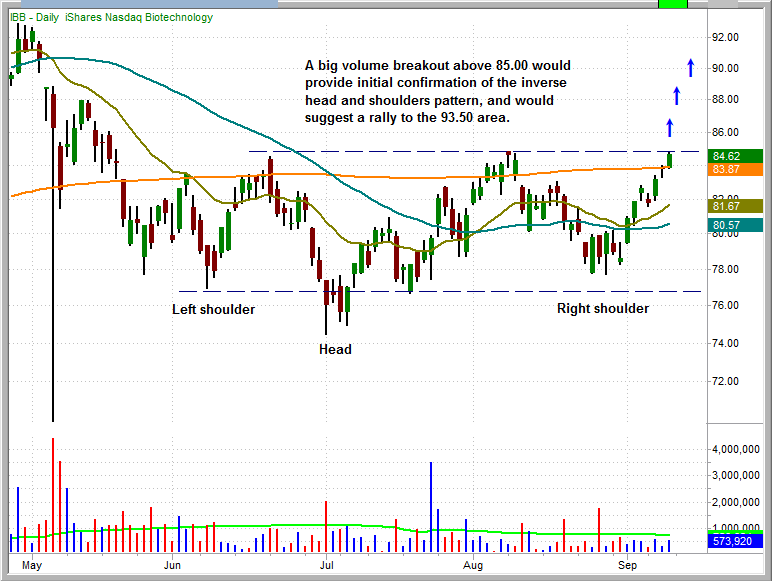
Last Monday (September 13), we offered the following commentary on the iShares Nasdaq Biotechnology Index Fund (IBB): "IBB appears to be forming a distinct inverse head and shoulders pattern. The left shoulder low was set on June 8, the head on July 1, and the right shoulder on August the 25 (see chart below). On Friday, it broke above the 200-period simple moving average on increasing volume. A volume-fueled move above the neckline high of $84.81 would confirm the pattern. The predicted rally, measured from the bottom of the head to the neckline, would suggest an advance to near the March 24 high of $93.53." Below is the chart that accompanied the commentary:

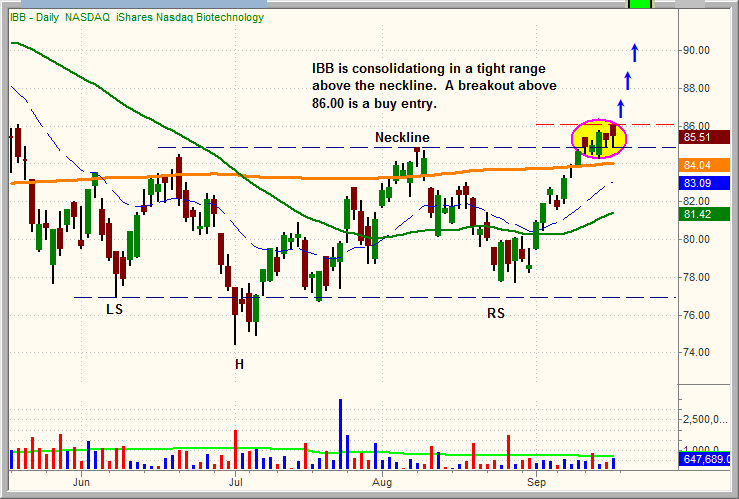
IBB has been consolidating above its neckline for five consecutive days. A break above $86.00 would now trigger the entry. Regular subscribers to The Wagner Daily will see our detailed trigger, stop, and target prices on "Today's Watchlist" below:

Deron Wagner is the Founder and Head Trader of both Morpheus Capital LP, a U.S. hedge fund, and MorpheusTrading.com, a trader education firm.
|