We'll be taking a look at several things today. This is actually a bit of a teaser, since we'll be focusing in on each of these ideas in more detail over the next few days. But for today, we just wanted to give you a few things to mull over the weekend. They're all inter-related, although it may not be readliy apparent just yet.
Oil: Well, I can't say I'm surprised oil was toying with new highs a couple of days ago. That's the overall trend that's been in place for over a year now, and I can't see any reason why that would change. While there will continue to be wild swings in oil prices (and therefore oil stocks), in the grand scheme of things, it's the balance between supply and demand that sets the price. That balance hasn't changed in years - the global consumption is just a tiny fraction under global production. So, the same balance that drove prices higher last year is likely to do the same this year.
Crude oil closed at $53.54 per barrel on Thursday, or $1.23 lower. Why? Oil inventories were up, and Chinese demand for oil was tapering. So, down oil went. Is this the end of the uptrend for oil prices? Not likely. I distinctly remember those same predictions being made in early December when crude prices plunged from $55 to $46. Oil prices were on the way down, said many 'experts'. Here we are three months later, and oil is far from 'down'. In fact, oil is right back at its high. Granted, a lot of that pricing pressure back then was rooted in the possibility of a cold winter and the need for heating oil. That's not going to be the case as we roll into spring, but there will probably be something else driving the price higher. After all, the market always has a way of pricing in future events - even before they become apparent. In other words, the current price at $55 is the 'right' price for right now. And the trend.....well, the uptrend is still intact. In the meantime though, I do expect a bit of a pullback.
Inflation: Inflation fears were abated a bit this week, but again, I'm not sure if I agree with that opinion. With interest rates still as low as they've been in decades, consumer and corporate demand could keep growing by enormous proportions. So why the easing of inflation fears? Jobless claims were higher than expected. Well folks, as someone who watches the employment data each and every week, take it from me - all that could change by next week. That jobless data is just too inconsistent to be used to make a decision as important as whether or not inflation is a real threat or not. Between the possibility of a quick turnaround in new jobless claims coupled with long-term 'cheap money', I'm still betting on inflation being a real problem.
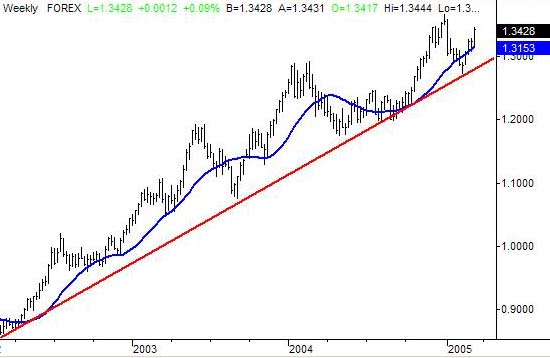
The U.S. Dollar: Like oil, a lot of folks felt that the dollar couldn't possibly get any weaker after hitting an all time low in early January. Yes, a bounce up from that low was likely, and we got it. But there was no evidence (on the chart) that the dollar was ready to recover in the 'bigger picture'. This is quite evident on our chart of the euro/dollar chart below. Our chart is rising because it reflects the strength of the euro in relation to the dollar, instead of the opposite. Just remember that the higher this chart goes, the weaker the dollar is. A few days ago this chart worked its way back above the 100 day average (blue) after hitting a long-term support line (red). And as of yesterday, it looks like we're gaining some momentum that could push the dollar to yet another new low. As always, we'll bet on what the chart is telling us - the dollar is still weakening. In fact, if the Fed starts to back off on interest rate hikes (ironically, one of the results of stifled inflation), the dollar could see even more trouble.
Euro/U.S. Dollar - Weekly

That's all - just a quick update on some of the recent hot buttons. We're not trying to take less popular opinions just because we're contrarians. We just try and base our analysis on facts and trends, rather than a single point of data that can be interpreted in many ways. We'll be detailing these ideas (and adding a few new twists) next week.
P.S. I'd love to receive feedback from you. Please leave a comment or discuss the article by clicking on "Make a comment on this article" below.
Price Headley is the founder and chief analyst of BigTrends.com, which provides daily stock and options recommendations and education.