| Corcoran Technical Trading Patterns For September 21 |
| By Clive Corcoran |
Published
09/21/2010
|
Stocks
|
Unrated
|
|
|
|
Corcoran Technical Trading Patterns For September 21
The clear break above 1130 on the S&P 500 cash index yesterday puts upper targets now in play with 1170 and then 1200 as distinct possibilities in coming weeks. However, on a cautionary note, one should not underestimate the capacity for disappointment if the FOMC do not articulate a clear signal that another round of QE is on their agenda.
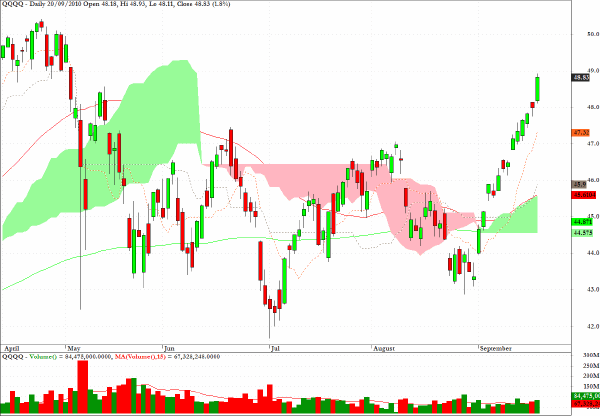
QQQQ has reached up exactly to the $49 level which I discussed here last week and, as noted yesterday, the ascent pattern since the beginning of September suggests that a lot of favorable news has already been discounted by traders. Could a bout of selling on positive news be in store for those who have enjoyed a nice ride up so far this month?
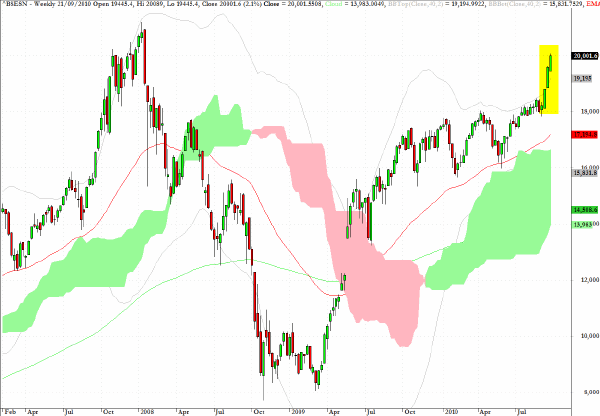
My favorite chart for today is for the Mumbai exchange which managed to close just above 20,000 during trading in Asia on Tuesday.
The weekly chart shows just how much ground has been covered not only during the last month but also since the lows of late 2008/early 2009. I would suggest keeping an eye on this index in coming sessions for any evidence of a buying climax and exhaustion arising in the vicinity of the previous highs from early 2008.
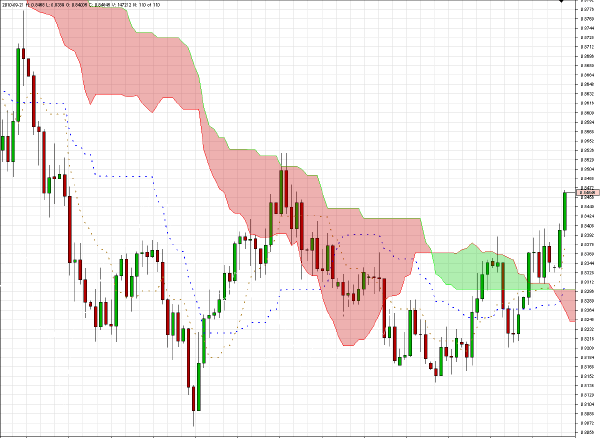
My comments over the last couple of commentaries regarding EUR/GBP could have generated a nice return already from partially scaling out of a long position, and I would maintain the target around 0.8530 as still valid for the remaining portion of the position.
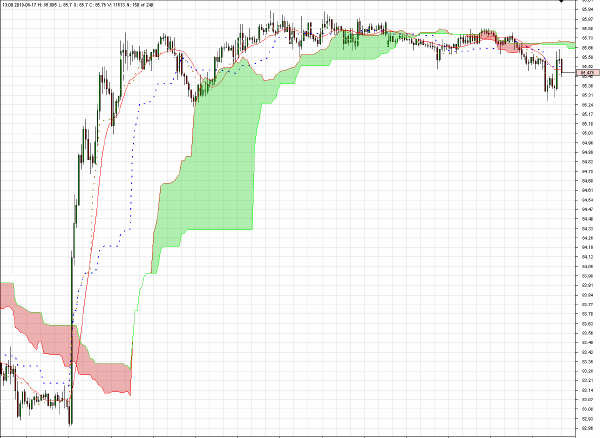
The 30-minute chart for USD/JPY is one of the most unusual looking sideways patterns that I can recall and shows that with the threat of BOJ intervention on the one hand and a reticence to sell the yen on the other this part of the FX market is virtually paralyzed.
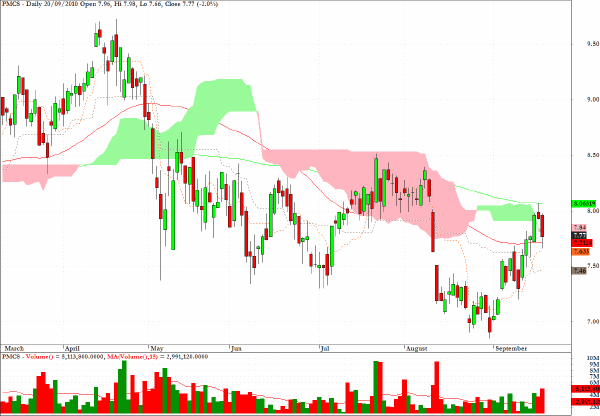
PMCS, a semiconductor stock, has one of the least constructive charts among individual equities.
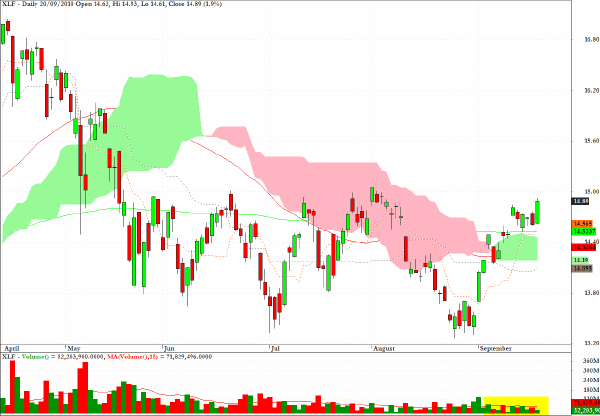
While risk on is in the ascendancy there is little temptation to short most market sectors. The volume pattern for XLF in recent sessions, however, suggests that there is not much enthusiasm behind the recent price gains.
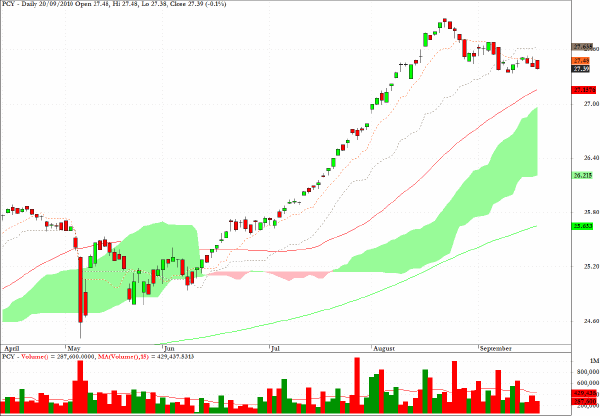
PCY, the exchange traded fund which tracks the sovereign debt from emerging markets, and which I have mentioned here recently, continues to display a negative tone where further price erosion seems likely.
Clive Corcoran is the publisher of TradeWithForm.com, which provides daily analysis and commentary on the US stock market.
|