Good morning! After Tuesday afternoon's sharp decline, the market fell back into it's old habit of forming a choppy trading range. This has been the case throughout most of this month so far. Only rarely has it been punctuated by some sort of intraday trend move. Only on the 2nd did that trend last the entire day. Even in that case, however, the primary action was in the morning with a sharp upside move and the rally slowed dramatically into the afternoon.
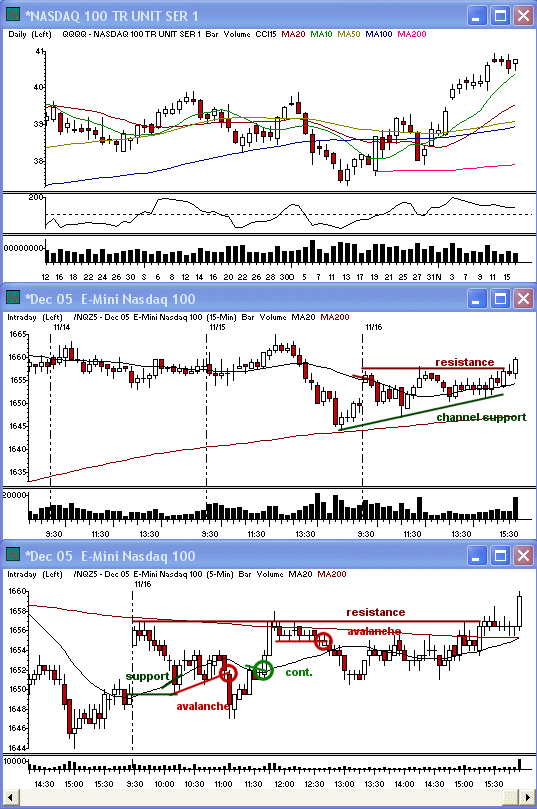
The range on a whole was very narrow on Thursday with light volume. The morning began with a gap higher into resistance at the 15 minute 200 sma on the all sessions futures charts and the 15 minute 20 sma intraday. This larger intraday level held very well and selling came in almost right away, leading to a closure of the gap in the first 45 minutes of the day. At that point the markets began to diverge once again. The SP500 and Dow Jones Ind. Ave. continued lower while the NASDAQ Comp. formed a 5 minute Avalanche pattern by hugging its 5 minute 20 sma from 10:15 ET into the 11:00 ET reversal period. At that point the support gave way for a quick little scalp move on the short side.
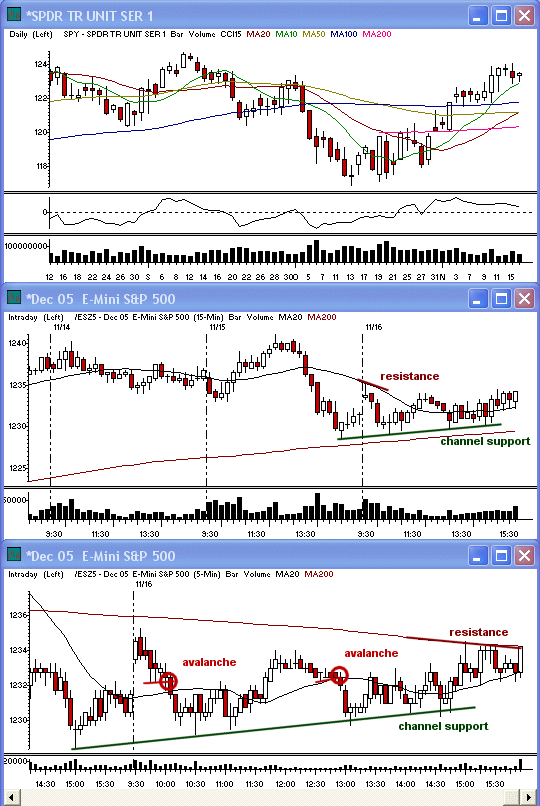
The strong pace on the decline intraday caused a slower start to the mid-day correction. At about 11:45 ET, however, the market spiked back into morning highs price resistance in the NASDAQ and the 5 minute 200 sma intraday on the weaker Dow. Both of these resistance zones hit at about the same time as the 12:00 ET reversal period, which helped them stall. Initially it was looking like we would see a continuation pattern form on the 5 minute charts since the market began to base along the resistance. Unfortunately, the pace within the base turned over and the 5 minute 20 sma support broke, leading to another wave of selling into the next reversal period at 13:00 ET.
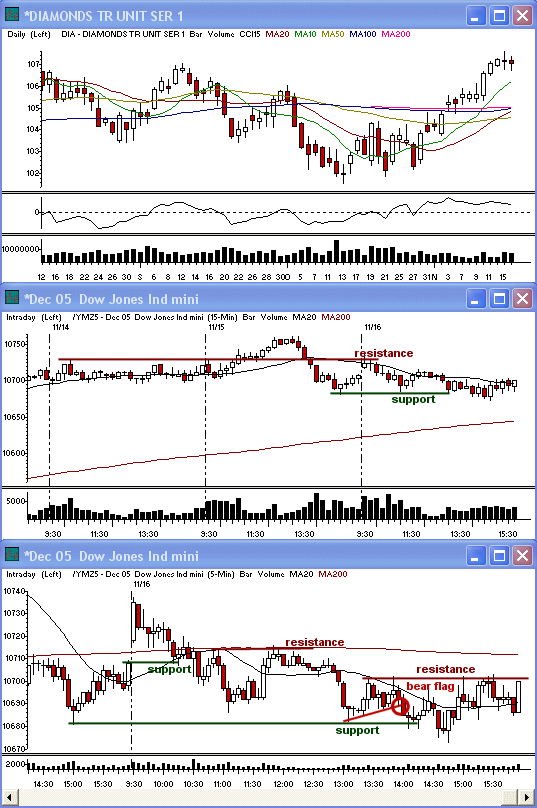
The remainder of the day became even more treacherous from 13:00 ET on. A breakdown attempt on the 5 minute charts at 14:00 ET barely managed to make new lows on the Dow. Even then it took a lot of back and forth action to get there and the NASDAQ didn't even retest its lows on the day. The overlap in prices from bar to bar on the 5 minute charts became even more pronounced and the risk increased dramatically for daytraders heading into the close.
Heading into Thursday, the market is looking higher since I would have expected a breakdown to have come on Wednesday afternoon to continue the prior afternoon's decline off the 30 minute 20 sma resistance. Since that broke higher though, it shows that the bulls are just not quite ready to give up their gains. We still have a lot of overhead resistance on the weekly charts in this zone, so I will still be treating longs as more scalpish.
Economic Reports and Events
Nov. 17: Building Permits for Oct. (8:30 am), Housing Starts for Oct. (8:30 am), Initial Claims 11/12 (8:30 am), Capacity Utilization for Oct. (9:15 am), Industrial Production for Oct. (9:15 am), Philadelphia Fed for Nov. (12:00 pm)
Nov. 18: Leading Indicators for Oct. (10:00 am)
Nov. 21: -
Nov. 22: Existing Home Sales for Oct. (10:00 am), FOMC Minutes (2:00 pm)
Earnings Announcements of Interest
Only stocks with an average daily volume of 500K+ are listed. List may not be complete so be sure to always check your stocks' earnings dates before holding a position overnight. (A) = Earnings after the close, (B) = Earnings before the open, (?) = Earnings time not specified at the time of this writing
Nov. 17: ARO (4:01 pm ET), ADSK (A), BKS (B), BEAS (A), CLE (06:00 am ET), FL (A), GPS (?), HRB (A), HPQ (?), KLIC (B), LTD (?), LTXX (A), MRVL (A), MSCC (A), JWN (?), PSS (?), SBUX (A), PLCE (B), DIS (?), WSM (B)
Nov. 18: ANN (B), CPWM (?)
Nov. 21: CPB (?), CBRL (?)
Nov. 22: ABS (?), CWTR (A), DE (?), DG (B), DLTR (B), HRS (?), MIK (A), OPSW (A), PETC (?)
Toni Hansen is President and Co-founder of the Bastiat Group, Inc., and runs the popular Trading From Main Street. She can be reached at Toni@tradingfrommainstreet.com.


 Free Festival of Traders Videos