| Corcoran Technical Trading Patterns For September 27 |
| By Clive Corcoran |
Published
09/27/2010
|
Stocks
|
Unrated
|
|
|
|
Corcoran Technical Trading Patterns For September 27
Friday’s strong rally in US equities took many by surprise and, judging by the volume characteristics which still are not registering what one would expect for a late Q3 session, the suspicion is that a lot of the upward price momentum was propelled by some end-of-quarter short covering by position traders.
Also significant as background music were the comments from David Tepper on CNBC which amounted to little more than the simple message "Don’t Fight the Fed".
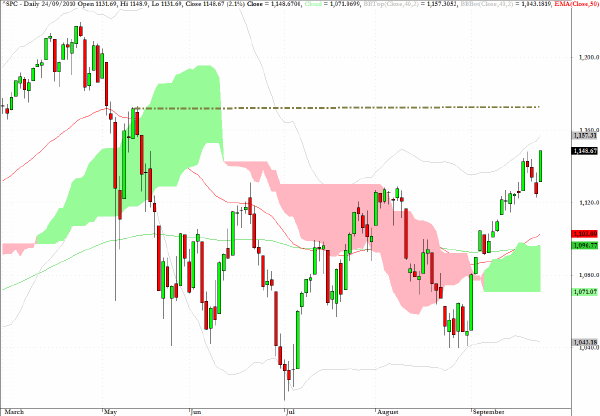
The target which is now on the agenda for the S&P 500 cash index, and could come this week, is the 1173 intraday high from May 12 in reaction to the May 6 mishap.
The only comment that I would make, and this is not necessarily evidenced by any technical indicators, is that the turn of Q3 into Q4 later this week could create some short-term choppiness. Also worth noting is that this Friday, despite being the first of the month, will not see the release of the NFP data, which will come on the following Friday.
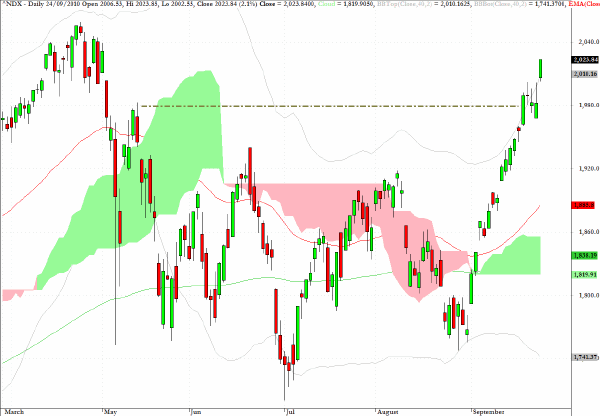
The Nasdaq 100 is in the vanguard of the bullish move up in equities and is largely being energized by Apple which is now the second most highly capitalized company in the world and about to take on the $300 level.
Although iPad and iPhones are wonderful gadgets it still baffles me that this company should command such a valuation. Indeed it is tempting to conclude that this may be the most loved stock in recent market history.
Anyway, I would now be looking for the NDX to test the April 26 high at 2059 in coming sessions.
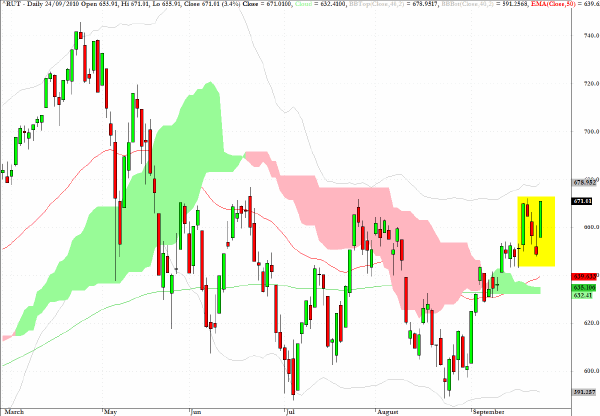
The Russell 2000 is still within a five session "trading box" despite the strong showing on Friday. A close above 680 would be yet another positive for the bulls.
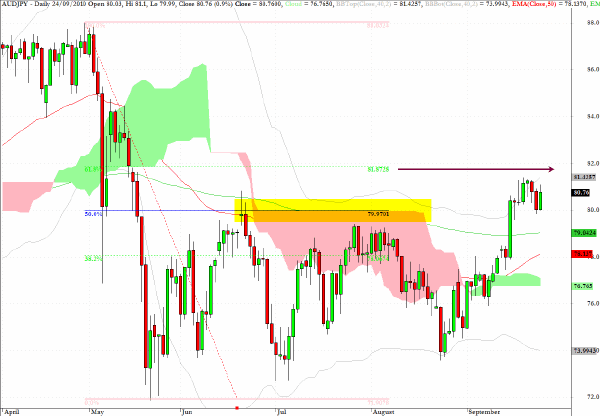
Applying the fibonacci grid to one of my favorite risk barometers, AUD/JPY, raises the distinct possibility of a target of 81.80 which would be the 62% retracement of the swing high/low visible on the chart
Also notice how the 50% retracement level exactly coincides with the extended cloud top in the middle of the chart, and that this would now act as a major support level.
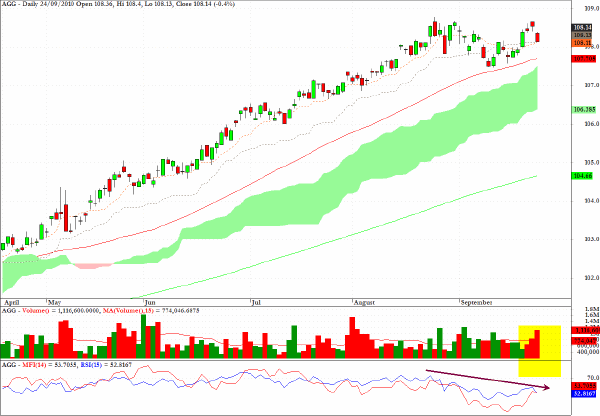
There is evidence from the candlestick action as well as the MFI and RSI chart segment that prices on investment grade corporate bonds, as reflected in the exchange traded fund AGG, may be ready to enter a correction.
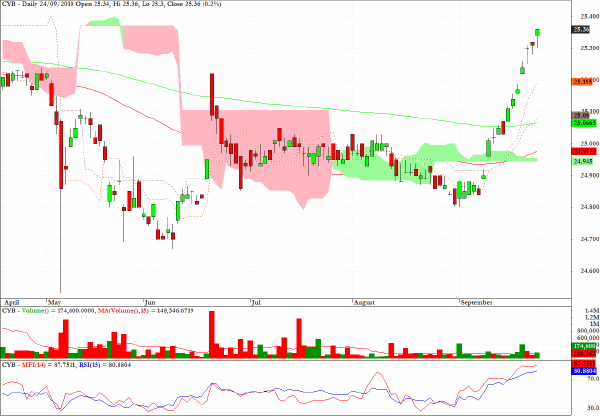
Hopefully readers have followed the suggestion first made here some time ago to participate in the gradual move up in the Chinese yuan, and with the political climate in the US now becoming more directly confrontational on this matter, further moves up seem likely.
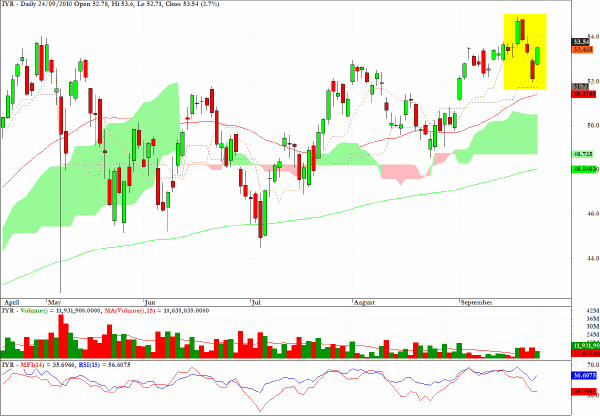
IYR looks attractive on the short side as it approaches the recent high.
Clive Corcoran is the publisher of TradeWithForm.com, which provides daily analysis and commentary on the US stock market.
|