| Corcoran Technical Trading Patterns For October 5 |
| By Clive Corcoran |
Published
10/5/2010
|
Stocks
|
Unrated
|
|
|
|
Corcoran Technical Trading Patterns For October 5
The Bank of Japan has been forced into desperate measures by effectively reducing its repo rate to zero and agreeing to purchase massive amounts of securities, including those backed by collateral which could be of very questionable value.
With the BOJ leading the way down this path, and with spot gold surging to more than $1325 an ounce, one is tempted to ask what more can central banks do when they reduce interest rates to zero and start buying all the dodgy paper that private banks don’t want?
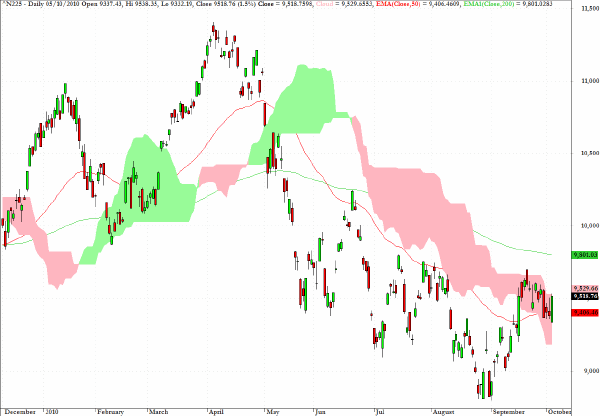
The Nikkei 225, in knee jerk fashion, responded positively to the weakening of the yen which followed the BOJ move, but within a couple of hours the Japanese currency was again headed higher on all major cross rates. It will be revealing to see just how long the BOJ waits before instigating another round of currency intervention.
Just for context here is a reminder of my comment from yesterday’s column.
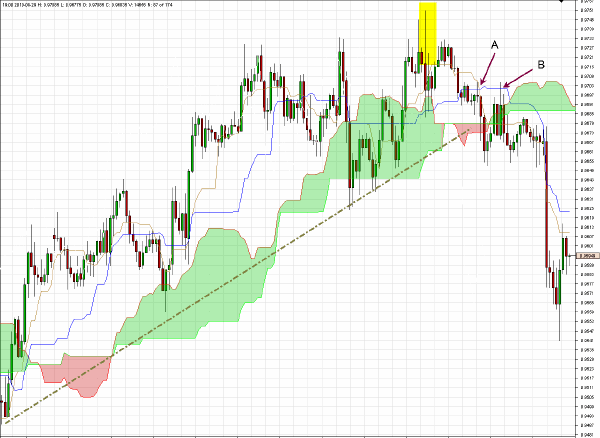
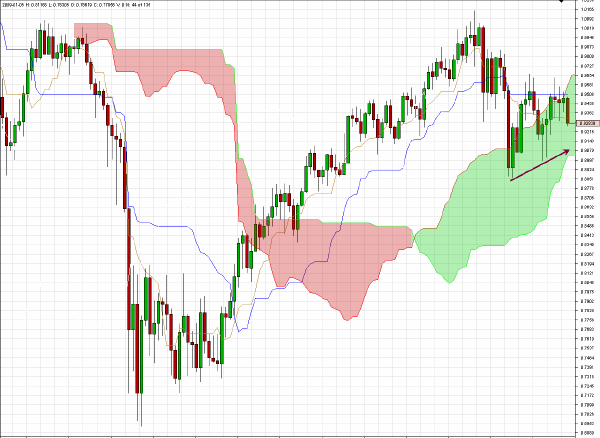
AUD/USD registered above .9750 since Friday, and as can be seen on the hourly chart, somewhat like the chart for EUR/USD, it will be interesting to see whether buyers show up near the current level. A break of the trendline would suggest that the Aussie dollar may struggle to regain sufficient momentum to take out the July 2008 high.
The Aussie dollar broke down in Asian trading and the key technical features to note on the hourly chart below are as follows:
1. The highlighted shooting star which failed to regain the July 2008 intraday high above 0.98
2. The crossover from above of the Tenkan Sen which is marked as A
3. Most significantly the failure to regain a foothold above the Kijun Sen level marked at point B.
On the 240-minute chart there appears to be some support around the .9550 level which should be tested in coming sessions.
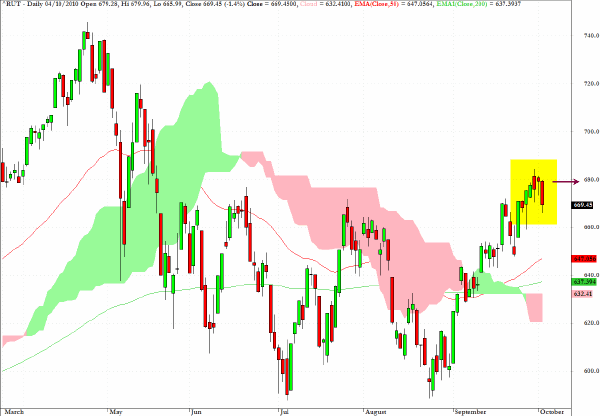
The Russell 2000 is finding it hard going to penetrate the critical 680 level and the waning appetite for the higher-beta stocks needs to be monitored for clues as to the near-term direction of US equities in general.
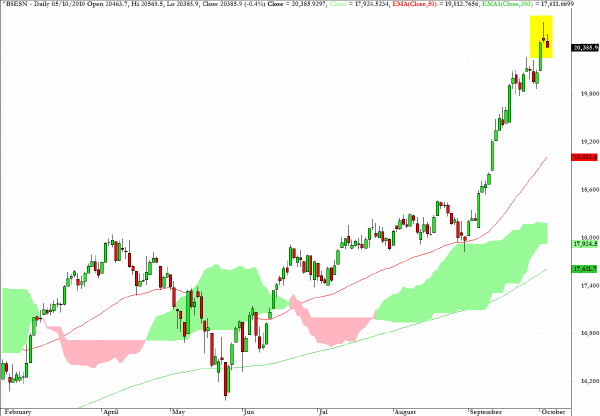
The Indian stock market as represented by the Mumbai Sensex, which has to be my favorite global index longer term, has registered a couple of candlesticks which may indicate that a consolidation lies ahead.
The long-term chart for AUD/CHF suggests that this risk on/risk off pair is approaching a fairly critical juncture which is worth monitoring periodically. Needless to say, a break below the base of the weekly cloud formation would suggest that risk assets would no longer be in favor.
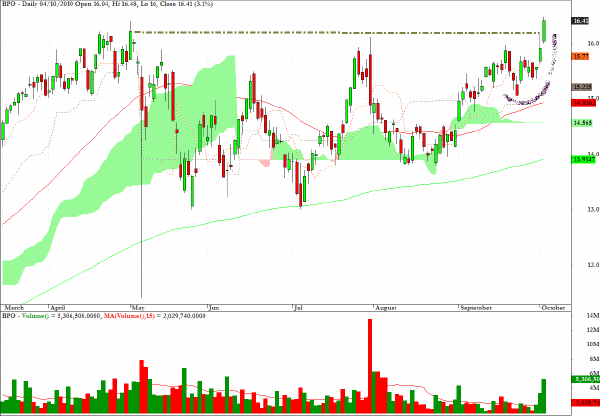
Brookfield Properties broke out to a new multi-period high on a sharp increase in volume and as the chart reveals there is evidence of an elongated cup and handle formation which can precede major breakaway moves.
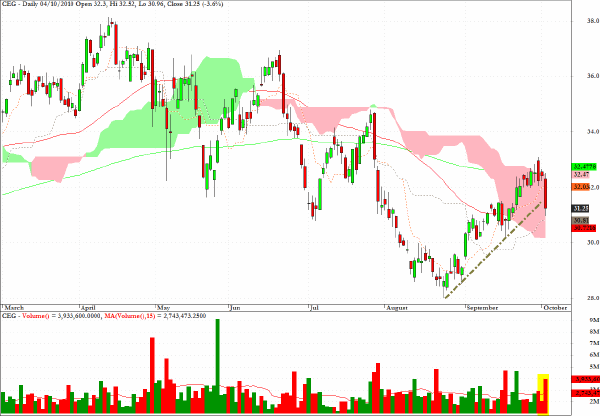
Constellation Energy Group (CEG) dropped below its 200-EMA and violated an uptrend line on heavy volume in yesterday’s trading.
Clive Corcoran is the publisher of TradeWithForm.com, which provides daily analysis and commentary on the US stock market.
|