It's so fun when you're on a research roll!
In our last episode, we covered the pros and cons of filtering our data field so that the winning percentages and profit per trade were higher. The downside is our total sample decreases significantly. There are ways we can work both sides of this issue and hopefully come up with a happy medium.
Finding additional stand-alone (read profitable) building blocks is one approach. If we have, say, five either-or indicators working together, we can still have a passable sample size if we stipulate that four of the five must be in agreement. So far we have four. Review the four indicators here.
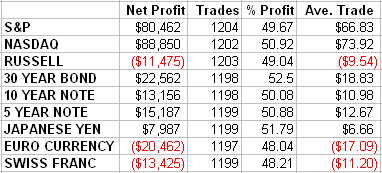
A very simple fifth concept looks at the relation of the close to the previous n-days worth of average-out highs and lows. Granted it's nothing earth shatteringly new under the sun, but let's first see how it works on it's own with the optimized number 15. (If the close is greater than the average 15-day high plus the average 15-day low divided by 2, then be a buyer. If vice versa, sell short). The following is five years of data.

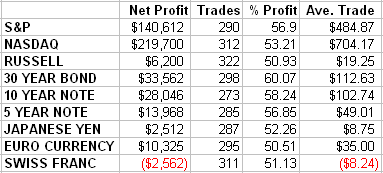
The next chart reflects the same analysis period. The new indicator is assigned a plus/minus value as are the previous four. We come up with something between -5 and +5 for each day. A +3 or better makes us a buyer, (four long signals, one short). A -3 or lower stipulates short sales. The following is five years of data.

P.S. I'd love to receive feedback from you. Please leave a comment or discuss the article by clicking on "Make a comment on this article" below.
Art Collins is the author of Market Beaters, a collection of interviews with renowned mechanical traders. He is currently working on a second volume. E-mail Art at artcollins@ameritech.net.