| Corcoran Technical Trading Patterns For October 7 |
| By Clive Corcoran |
Published
10/7/2010
|
Stocks
|
Unrated
|
|
|
|
Corcoran Technical Trading Patterns For October 7
With nearly all of my intermediate-term targets having been attained and the market feeling very "stretched" to me, there are very few favorable risk/reward scenarios that are presenting themselves for today.
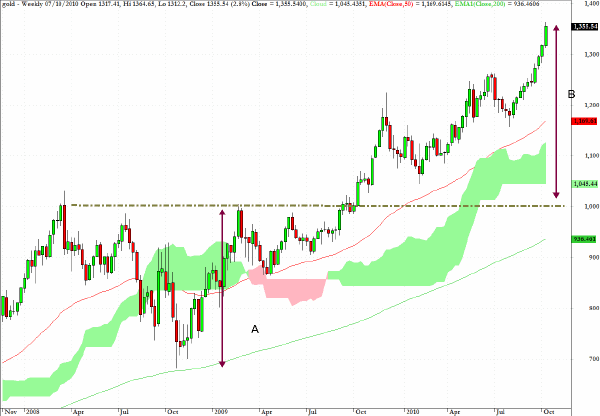
Spot gold has traded up to $1364.65 so far in European trading and could be about to go parabolic but for now the target zone which I have discussed going back to last October, based upon price projections from the inverted head and shoulders pattern, has been reached and I would move to the sidelines as my guess is things could get pretty wild in the next 36 hours across many markets.
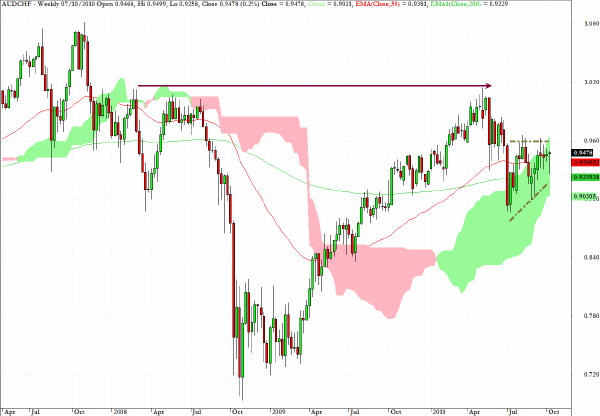
Not too many commentators pay attention to AUD/CHF, which is why I find it particularly interesting and worth studying.
What is of most interest is that despite the Aussie dollar making a new historic high earlier today the cross rate against the Swiss franc is far below that indicated by the arrow on the chart. This is, of course, because the Swiss Franc continues to move to multi-year highs against the dollar.
The paradoxical nature of AUD/CHF highlights the bipolar nature of the capital markets in general at this time. On the one hand AUD which is a risk on asset seems to be about to reach parity with the US dollar, while CHF which is typically associated with a safe haven mindset and risk off is also breaking to new highs.
Tread carefully is the message that this sends to me at least.
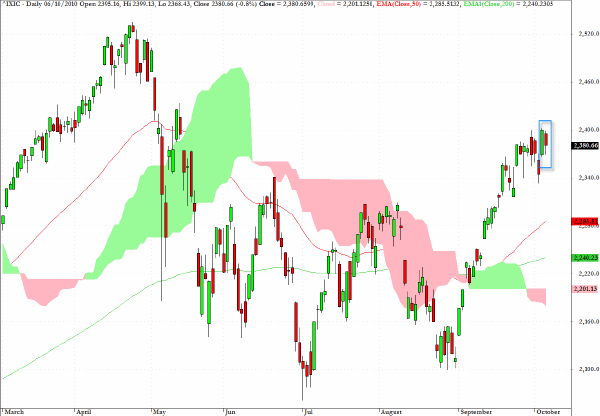
On Tuesday I drew attention to the pullback in the Russell 2000 as casting some doubt about the value of the higher beta stocks, and, just to prove my hypothesis wrong, the Russell 2000 staged a major reversal in Tuesday’s session. However, the candlestick registered for the micro cap index yesterday was a relatively small body inside session.
Also the same can be seen on the chart for the Nasdaq Composite index. Often such patterns are precursors of reversals, however given the current mood of euphoria where asset managers seem intent on buying everything from the proceeds of selling the US currency for almost any other means of exchange, it would not surprise me to see a further rally in the S&P 500 up to the 1170 level.
However I will not be participating with any position in global equity indices during today’s session and until after the NFP data is released tomorrow.
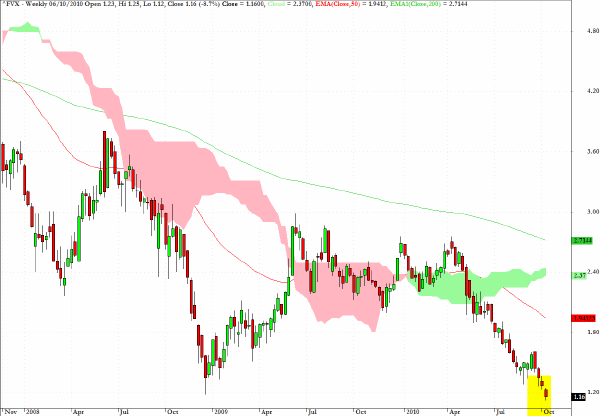
The yield on the five-year Treasury note is seeking out new lows in uncharted territory.
I commented a while ago, via my Twitter account, that my best guess is that QE is about 80-90% already priced into current Treasury yields and there is always the remote possibility that US economic growth could be more robust than the Fed expects. Needless to say UST’s seem to be well priced.
The one event that could take UST prices even higher would be another, but more sustained, flash crash type of event. Correlations between key ETF’s and FX pairs are approaching extremes but surely the market couldn’t succumb to another technical glitch as happened on May 6, could it?
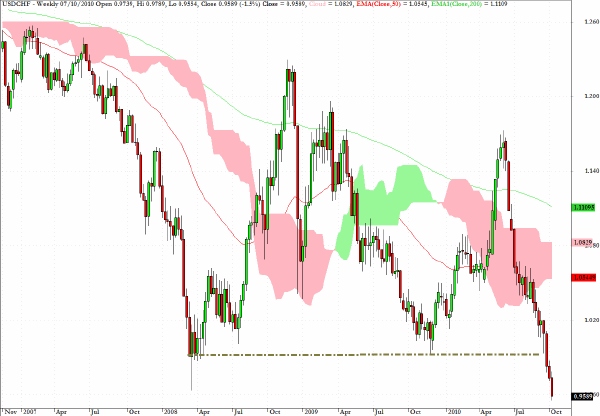
USD/CHF having broken below the 0.96 level and touched 0.9550 earlier this morning is also in uncharted territory. If you are long gold at this point I would suggest monitoring USD/CHF for near-term clues as to directional changes as the two instruments tend to move in harmony.
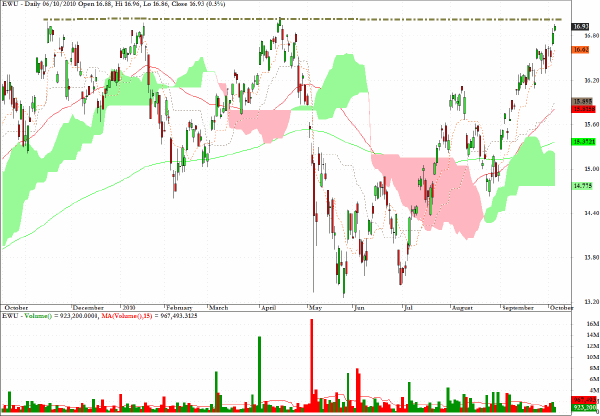
EWU, which tracks the MSCI UK index, and is a fairer barometer as to performance of British companies unlike the FTSE 100 which is more global in scope, has reached again to a level where there has already been a triple top rejection.
It will be revealing to see whether on the fourth attempt it can break beyond the range that has confined it for the last year.
Clive Corcoran is the publisher of TradeWithForm.com, which provides daily analysis and commentary on the US stock market.
|