| Corcoran Technical Trading Patterns For October 14 |
| By Clive Corcoran |
Published
10/14/2010
|
Stocks
|
Unrated
|
|
|
|
Corcoran Technical Trading Patterns For October 14
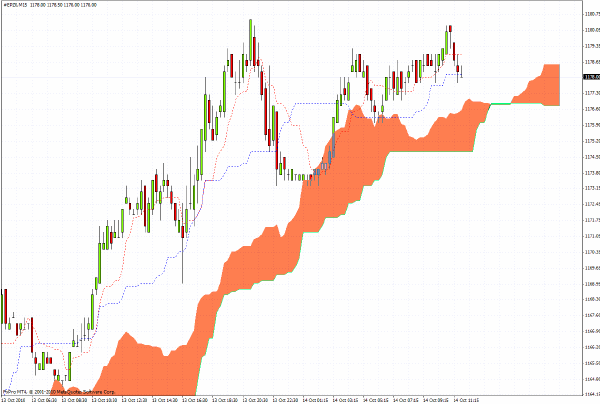
The S&P 500 cash index closed yesterday’s strong session above 1178 and reached almost 1185 intraday.
Meanwhile, the Nasdaq 100 not only registered a new multi-period intraday high but registered a close at 2057.2 which is the highest level since before the bleak events of the second half of 2008.
Clearly equity markets are extremely "enthusiastic" about the prospects for more largesse from Chairman Bernanke, and, to some extent, from strong results/forecasts from Intel and JPM (although JPM’s results were not as good as they appeared on a quick analysis).
Meanwhile, in Asian trading the US dollar got slammed and the price of gold has exceeded $1385 (and silver has almost touched $25).
I'll be recording a broadcast slot for Reuters Insider today about currency wars and the slumping dollar.
In essence I'll argue that the likelihood of some dramatic moves in FX are increasing and that other asset classes are now at risk from big FX and commodity dislocations.
While 1200/1220 on S&P 500 still could prevail – for me the zone between where we are now and the April high is one where the risk/reward ratio is becoming less appealing with every move higher.
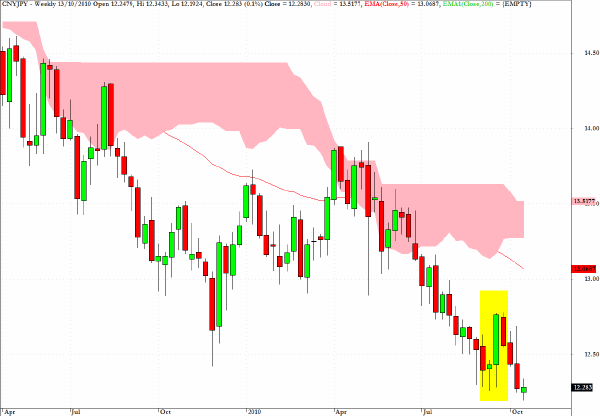
The following chart for the cross rate between the Chinese currency and the Japanese yen reveals more about the currency war issue than attempting to unravel any of the IMF discussions that took place in Washington last weekend.
FT had an Alphaville article this morning which talks about a dollar meltdown and included the following remark.
Someone’s going to step back and think of the consequences of a really weak dollar at some point, surely…
Yes, the Chinese, with $2.65 trillion in foreign currency holdings (much of it in US Treasuries), already are.
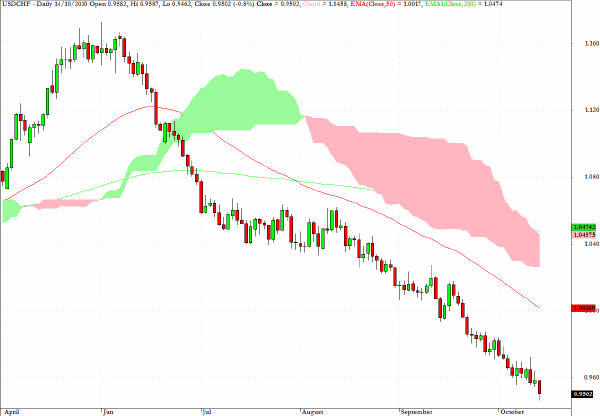
The following daily chart for USD/CHF has one of the most remarkable downtrend patterns that I can recall seeing on an FX chart, and the question has to be asked, and clearly is being considered by major global asset allocators:
If Inflation is now official US policy, are those buying gold, commodities and Swiss francs, Armageddon merchants or prudent investors?
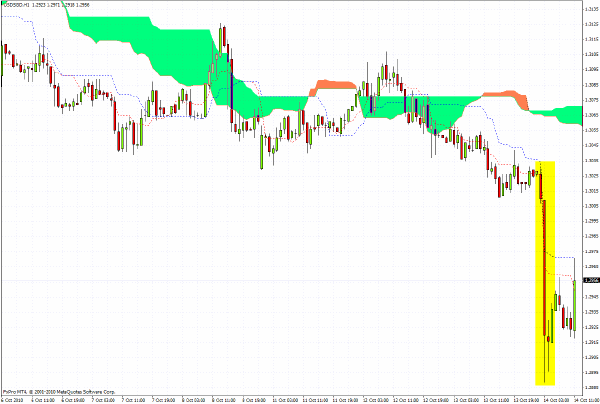
The Singapore central bank has re-adjusted its managed currency bands to allow for more appreciation of the Singapore dollar upwards against the dollar - perhaps sending a message to its Chinese counterparts.
As the hourly chart below shows the affect in Asian trading was for another immediate dive for the US dollar.
When trading in FX becomes so simple as to sell the US dollar against all other currencies then it is surely time to pause and assess the risk landscape.
Embodiment of market bipolarity - risk paper assets love more QE yet all other indicators including FX, gold, etc. saying be very careful.
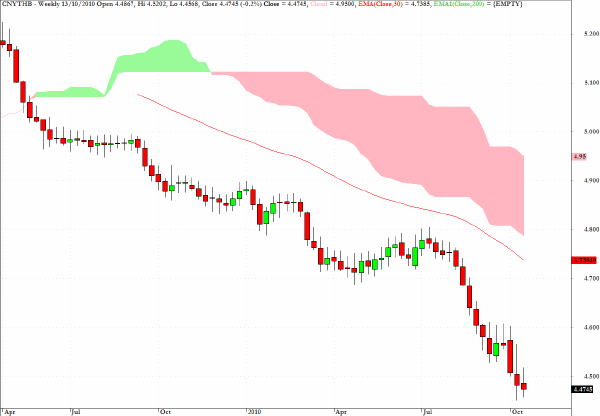
The weekly chart below for CNY/THB helps to illustrate why the Thai government is introducing a withholding tax on "hot money" seeking out yields on Thai securities.
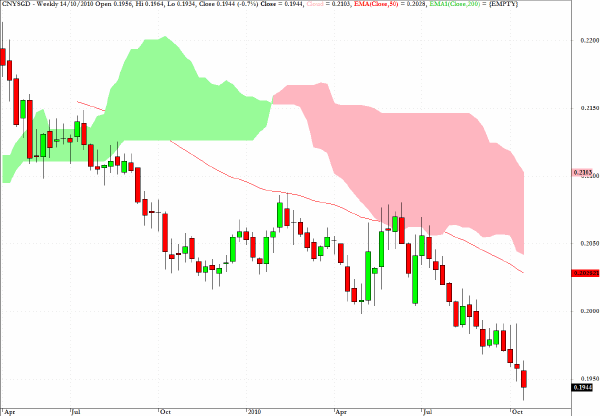
One other chart which helps to explain the actions of the Singapore government in Asian trading on Thursday also speaks for itself...it is the relationship between the Chinese yuan and the Singapore dollar.
You don’t have to look too closely to see that this chart shows that, as George Soros alleged in an interview over the weekend, the Chinese "effectively control the global currency system". And one could add, with $2.65 trillion under management, who can blame them?
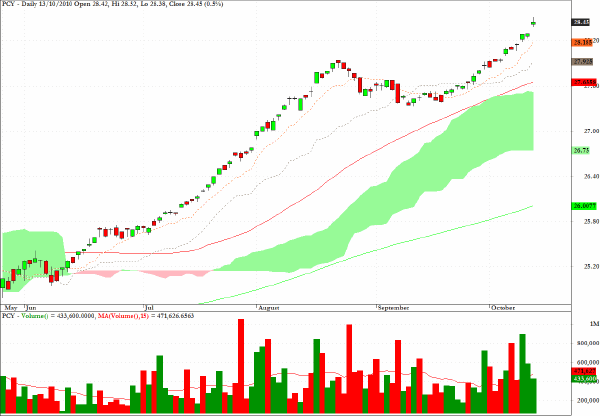
PCY, the exchange traded fund which tracks the sovereign debt from emerging markets, and which I have mentioned here recently, manifests the problem of too much liquidity in search of yields.
It looks extremely overdone to my way of thinking but it could get even more so before the bubble bursts.
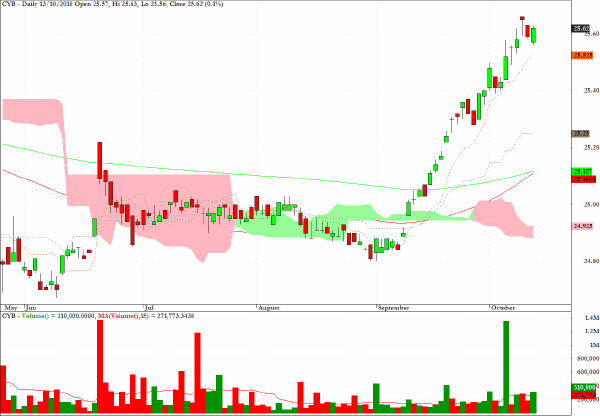
Here again is a comment from the September 27 newsletter.
Hopefully readers have followed the suggestion first made here some time ago to participate in the gradual move up in the Chinese yuan, and with the political climate in the US now becoming more directly confrontational on this matter, further moves up seem likely.
Clive Corcoran is the publisher of TradeWithForm.com, which provides daily analysis and commentary on the US stock market.
|