| Corcoran Technical Trading Patterns For October 18 |
| By Clive Corcoran |
Published
10/18/2010
|
Stocks
|
Unrated
|
|
|
|
Corcoran Technical Trading Patterns For October 18
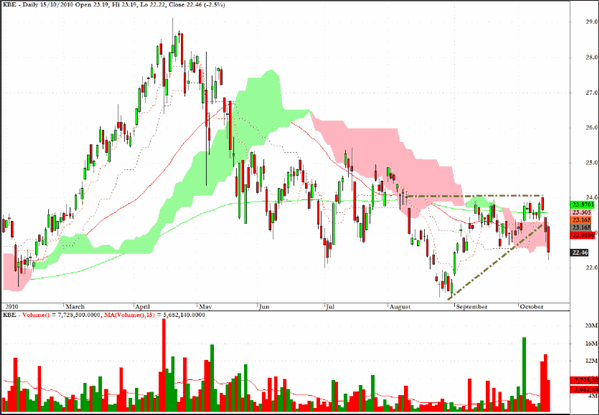
The exchange traded fund, KBE, which tracks the KBW Banking Index has definitively violated the uptrend line shown, failed as part of an ascending wedge pattern and closed the week below its Ichimoku cloud formation.
Just how severely the banks could be hit again by the resurfacing of the mortgage-backed securities mess remains to be seen. The real damage is being done to major pension funds and other asset managers that are not only heavily exposed to the financials, through holding equity and debt of the large banks, but also directly by their ownership of the same toxic waste that the large banks still own.
Here is an opinion I expressed on the matter which was published during the weekend.
In essence, the reason why this issue could become one of systemic risk is that a broken chain of title is far more threatening to a legal/economic framework which is based on unambiguous property claims rather than any red herrings about dematerialized securities.
Needless to say, those who do not want to shine a light on this matter and clean up the mess will want to confine the debate to nuances related to electronic registration (MERS), SPV’s and other opaque entities. It’s just a version of divide, mystify and distract.
As many are now realizing, the truth is that during the porcine inspired rush to create and sell MBS’s, very often the conveyancing of ownership slipped through the cracks and the chain of legally enforceable title transfer has been broken.
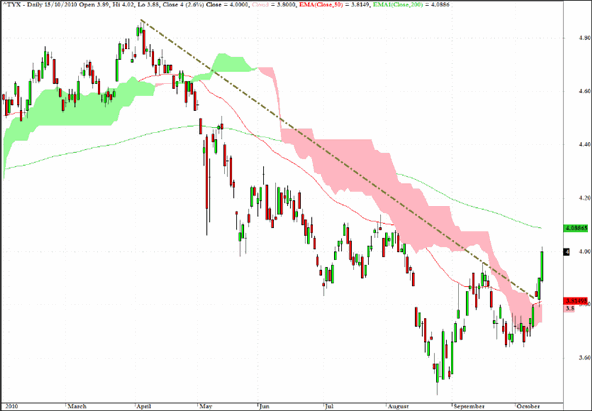
Following the official nod from Chairman Bernanke last Thursday that the Fed stands ready to buy hundreds of billions of dollars of Treasuries, not surprisingly the incipient bond market sell-off gained momentum on Friday, with plenty of chatter that PIMCO was unloading a lot of inventory. In particular the long end of the Treasury spectrum has seen the worst in terms of yield appreciation with the 30-year bond closing at 4% on Friday.
One reason behind this drop in price is an arbitrage being played by many large funds where the assumption is that the Fed will be focusing its buying on the 5-10 year maturities. Accordingly going long the intermediate part of the yield curve and selling the long end is being seen as an attractive spread trade. However the Fed has previously surprised the market by buying 30-year bonds and the arbitrage may not turn out to be as easy a way to make money as anticipated.
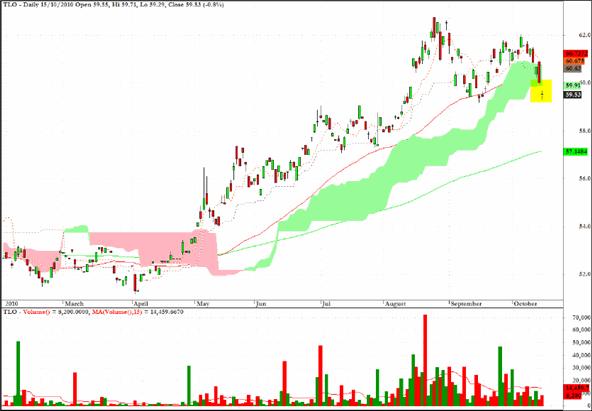
TLO is an ETF which seeks to provide investment results that correspond generally to the price and yield performance of an index that tracks the long-term sector of the United States Treasury market.
In determining how much significance to attach to the drop below the cloud formation, there is the matter discussed above in regard to the yield curve arbitrage as well as the tiny doji candlestick pattern which can sometimes be seen when a market is experiencing conflict and indecision.
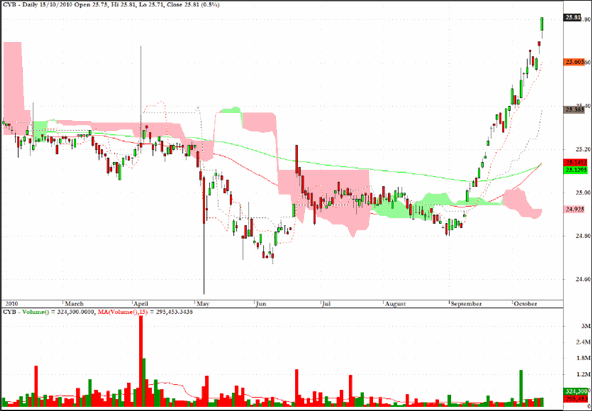
It has been reported this morning that the Chinese central bank is considering maintaining its managed floating of the yuan but increasing the upper band which would allow for further incremental gains of CNY against the dollar. This is similar to the policy decision taken by the Singapore authorities last week and which I discussed here .
The exchange traded fund CYB remains an attractive long-term play as further yuan appreciation should be expected.
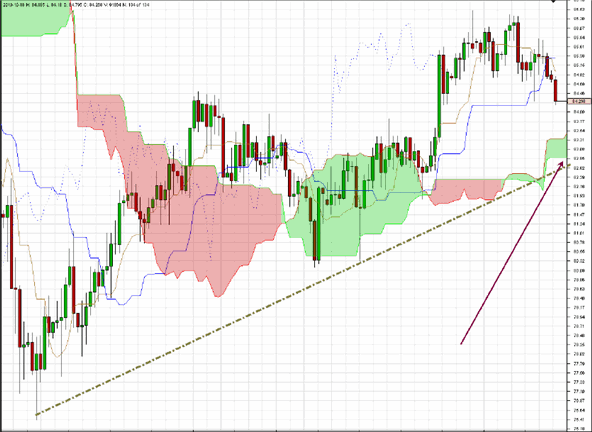
CHF/JPY should be monitored for a potential test of the trend line annotated on the 240-minute chart below which also coincides with the base of the Ichimoku cloud formation.
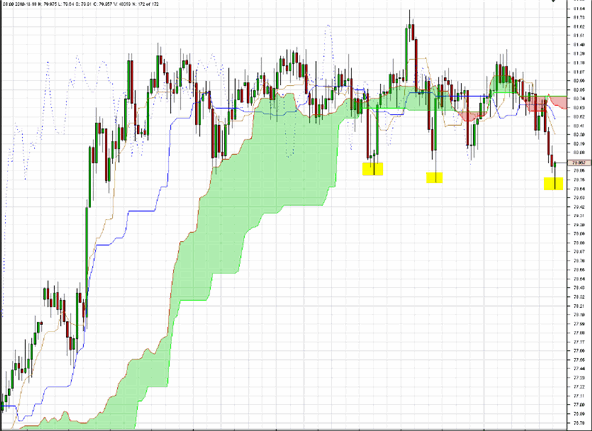
AUD/JPY has still not violated the support levels on the 240-minute chart, discussed here last week, but, as highlighted, there have been a succession of marginally lower lows seen over the last few sessions.
The pair remains on my focus list for this week, and as suggested previously, any serious breakdown in this pair would signal a warning to lighten up on exposure to the usual suspects among risk assets.
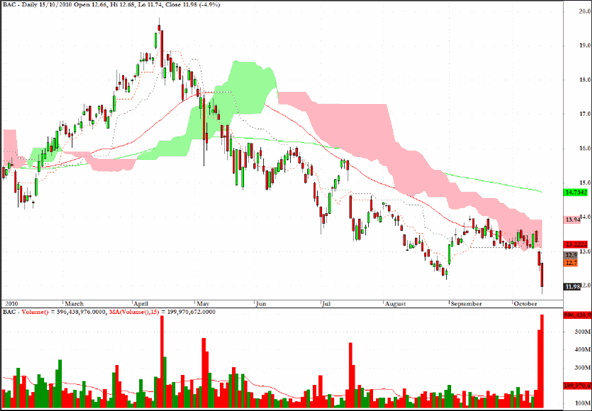
The chart for Bank of America (BAC) captures the fear that has arisen following the moratorium on further foreclosures and all of the associated implications regarding the value of asset-backed securities on the bank’s balance sheets.
Undoubtedly short sellers are taking large positions on this stock (and other large financials) and there are likely to be some violent whipsaws as traders try to comprehend the severity of the new malaise which should not have been a surprise to those who have been paying attention to the whole MBS debacle.
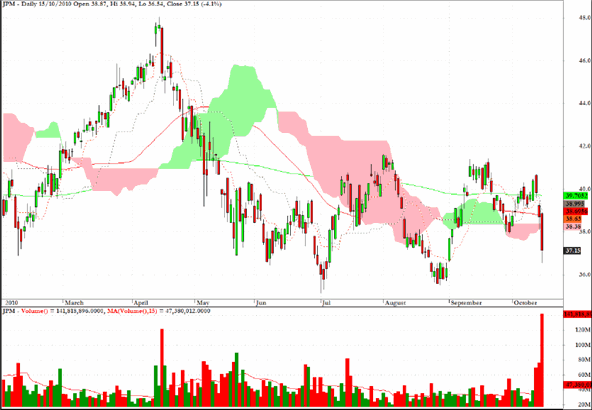
The chart for JP Morgan (JPM) is slightly less severe than that seen for BAC but a re-test of the early July low would seem to be highly probable.
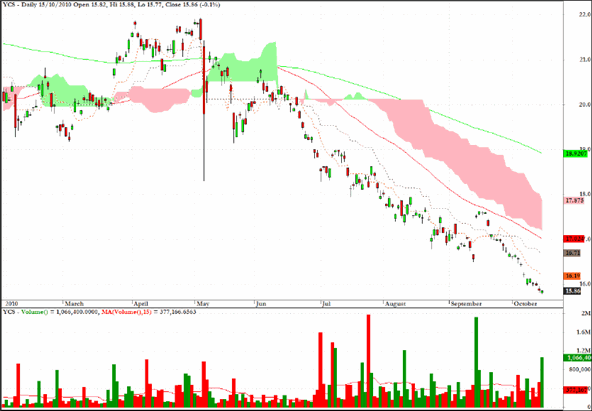
The exchange traded fund, YCS represents a leveraged vehicle which rises on yen weakness. I am not trying to call a bottom in the dollar/yen rate but I would say that for those with a longer term horizon there are some technical suggestions that the US currency looks "sold out" against several currencies, and in particular the yen.
Clive Corcoran is the publisher of TradeWithForm.com, which provides daily analysis and commentary on the US stock market.
|