Some of our subscribers and readers have asked us to explain the Rydex sentiment indicator that we use so often. Rydex is the name of a unique mutual fund family that caters mostly to institutions. One reason the fund family is unique because they offered the first "short" fund. They also were the first fund family that offered a leveraged fund. Rydex also requires relatively high account minimums. This attracts a lot of institutional money. Rydex also allows unlimited fund switching within the family. Most fund companies limit the number of switches that can be made in a year. As such, there is plenty of speculative fund switching. That is why we like to use the Rydex. The fund switching is unlimited, speculative, and is implemented mostly by institutions.
The sentiment indicator that we use is a combination of the 3 funds: the Nova, OTC, and Ursa funds. The Nova fund is a leveraged version of the S&P 500. The leverage is 1.5 times, which means that when the S&P 500 moves up 1%, a 1.5% move should be expected from the Nova Fund. The next fund is the OTC. The OTC fund aims to mimic the movement of the Nasdaq 100. This fund is not leveraged and is also a bullish fund. The last fund is the Ursa Fund. Unlike the first 2 funds, Ursa is bearish and seeks to move exactly 100% the opposite of the S&P 500.
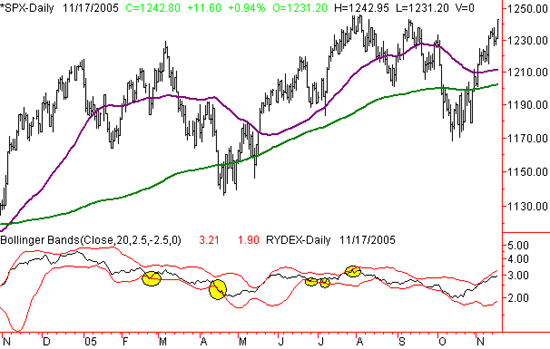
Those are the components of the ratio we use. We take the combined assets of the Nova and OTC funds (bull funds) and divide that number by the total amount of assets in the Ursa fund (bear fund). The resulting number is a ratio of bull dollars invested to bear dollars. As of the close on Tuesday, that number was 2.88 and was as high as 15.68 in March of 2000.
Like most of our indicators, this one is contrarian. In other words, if the crowd is bullish, we are generally bearish (at extremes).
Rydex Execution
The strategy we use is not that complicated. We are interested mostly in extreme levels of the Rydex ratio rather than a specific number. We like extremes because they give us insight into unusual trading activity, which can be indicative of what will happen in the future. We use 21-day Bollinger bands to find extremes in fear and greed. On a chart, a reading that is above the upper Bollinger Bollinger band means that investors are extremely bullish. That is when we actually become bearish because we believe that the market has overreacted and is likely to experience a correction. Specifically, we look for a close of the Rydex above the upper band, followed by a close within the bands for a bear signal. For a bullish signal, we are looking for a close below the lower Bollinger Band followed by a close above the band. We buy the market the next day and sell it in 30 days, or if we get a sell signal, or if we are not profitable after 5 days. On a bearish trade we wait for a close above the upper band, follow by a close back below the band. We then short the market and sell the position in 15 days, or if we are not profitable in 5 days, or if we get a sell signal.

When It Doesn't Confirm
The Rydex ratio is a high probability indicator. As with most high probability indicators, we are given insight even when it doesnt' work. Specifically when the indicators tell us to be bullish and the market moves down, it tends to move down even further. So, when the indicator doesn't work at an extreme, we often have valuable, actionable information either way.
In conclusion, the Rydex ratio is one we use as a contrarian tool at extremes. When the fund-switching reaches extremely bullish or bearish levels, we execute trades in the opposite direction.
Price Headley is the founder and chief analyst of BigTrends.com.